This two-week teaching module in an introductory-level undergraduate course invites students to explore the power of Twitter in shaping public discourse. The project supplements the close-reading methods that are central to the humanities with large-scale social media analysis. This exercise challenges students to consider how applying visualization techniques to a dataset too vast for manual apprehension might enable them to identify for granular inspection smaller subsets of data and individual tweets—as well as to determine what factors do not lend themselves to close-reading at all. Employing an original dataset of almost one million tweets focused on the contested 2018 Florida midterm elections, students develop skills in using visualization software, generating research questions, and creating novel visualizations to answer those questions. They then evaluate and compare the affordances of large-scale data analytics with investigation of individual tweets, and draw on their findings to debate the role of social media in shaping public conversations surrounding major national events. This project was developed as a collaboration among the English Department (Emma Davenport and Astrid Giugni), Math Department (Hubert Bray), Duke University Library (Eric Monson), and Trinity Technology Services (Brian Norberg).
Graduate Student: Emma Davenport
Faculty: Dr. Astrid Giugni
Course: “Democracy, Game Theory, and Persuasion” (English 190-1-01 / Math 190-01 / ISS 190-01; Spring 2019)
This Data Expedition introduces students to data visualization techniques and invites students to consider the advantages and limitations of large-scale data analysis as compared to close-readings of individual texts. What might be gained through employment of each method individually, and what is obscured? How can these techniques be used to support and extend each other? And what might we be able to conclude about the role of digital technologies in public discourse today?
In spring 2019, in the wake of the 2018 midterm elections, twenty-seven students enrolled in the introductory-level, interdisciplinary course “Democracy, Game Theory, and Persuasion,” a cross-listed English, math, and Information Science + Studies course investigating quantitative and qualitative approaches to understanding how democracy works. The course explored techniques of political persuasion through perspectives drawn from mathematical game theory, political theory, and literature. Emma Davenport, a fifth-year graduate student in the English department, designed this Data Expedition to supplement students’ theoretical and literary engagements with the question of how democratic discourse is shaped.
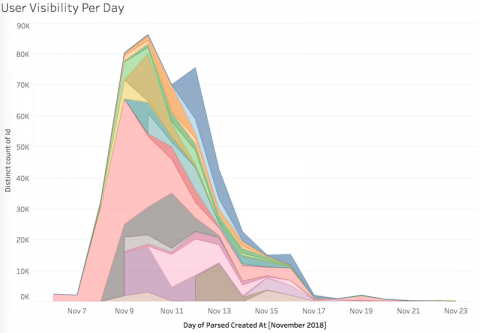
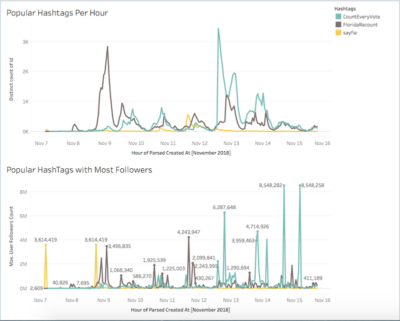
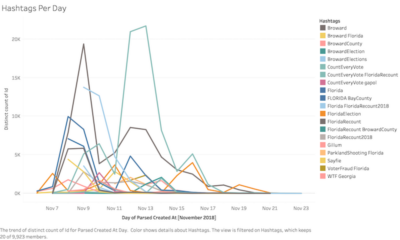
November 2018 saw two midterm election recounts in Florida (gubernatorial and US Senatorial) that attracted national attention and prompted massive activity on Twitter and other social media networks. This event and the public conversation it generated provided Emma an occasion for conceiving a project in which students could complete novel analyses using original data generated by a platform with which most of the students had daily contact, on a topic of national significance occurring just six weeks previous to the semester’s commencement. The dataset for this project consisted of a collection of 900,270 tweets and their associated metrics, which represented a ten-percent sample of all tweets mentioning any of eight specific hashtags related to the Florida 2018 midterm election recounts, from November 6 (election day) through November 23 (five days after the resolution of the recounts).
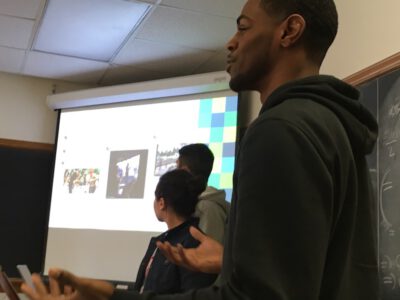
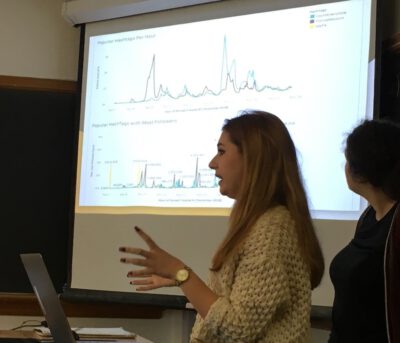
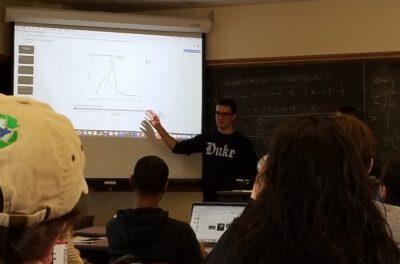
Over the course of four class sessions, students trained using visualization software, generated research questions, created novel visualizations to answer those questions, evaluated and compared the affordances of large-scale data analytics with close-readings of individual tweets, and drew on their findings to debate the role of Twitter in shaping the public conversation surrounding the event. On the first day of the unit, Emma guided students to think through the role of social media in their experience of current events and to discuss the ways that Twitter has developed and changed over its thirteen-year life. A central goal of this introductory discussion was to scaffold students’ integration of contextual information from outside of the dataset with phenomena that might be revealed by data visualization. Emma thus encouraged students to bring their existing background knowledge to bear on a timeline of the major events of the recount to articulate tentative expectations regarding relationships between individual events and Twitter trends.
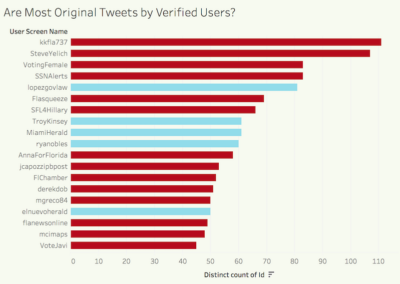
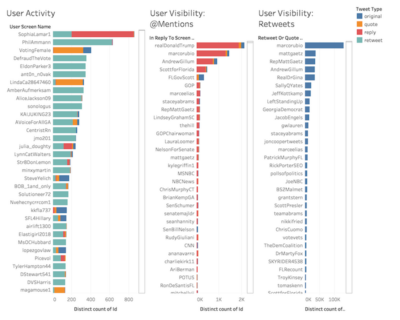
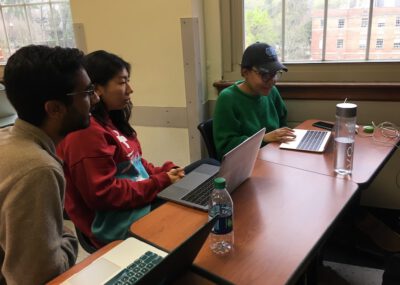
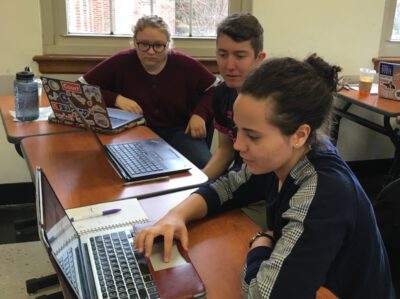
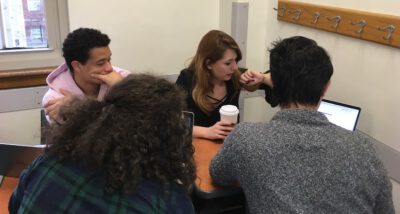
The goals for the second and third day of the unit were to familiarize students with the dataset and with visualization software Tableau and to support students in planning and executing an inquiry into a research question of their own design. Thus, on the second day, Emma conducted students through an exploration of the dataset’s variables and a discussion of the opportunities and limitations of Twitter’s API; trained students in Tableau; and assisted them in completing visualization exercises that prompted examination of patterns and anomalies in the dataset. Students devoted the third day to working in groups of three or four to pose questions about the data, record hypotheses, create visualizations to assist in answering their queries, compare conclusions drawn from the large-scale data to those offered by granular examination of individual tweets, and suggest further questions for examination. Students recorded their process on a planning template designed to assist them in focusing their inquiries, organizing their findings, and developing their methods and conclusions for presentation.
On the final day of the unit, students shared their findings with their classmates and drew on their explorations of the data to debate questions including:
- How “objective” are the measures of this dataset? Who are the actors whose decisions help determine the conclusions that we draw—and even the questions that we can ask—about the data? Where in the processes of collecting, analyzing, and presenting data do human factors intervene?
- What is the role of Twitter in shaping public conversations about current events? How is that role changing as Twitter and its users influence each other? What are the advantages to democratic discourse of the rapid rise of social media? What are the drawbacks?
- What questions and objectives oblige us to use large-scale quantitative analyses? What questions and objectives oblige us to closely analyze individual texts? What inquiries might benefit from the use of both, and how?
You are invited to explore the complete dataset, project materials, and student work via the download links below.
(all student work and photography posted with permission)
Images


Data-Exped-Schedule.pdf (PDF of four-day schedule)
Intro-Election-Twitter.pdf (PDF introducing the election recount event and the Twitter dataset)
Twitter-data-Master.xlsx (Excel data)
Tableau-Training-Exercises.pdf (PDF of instructions for completing training exercises)
Presentation-Assignment-and-Planning-Sheet.pdf (PDF of presentation assignment and planning sheet)
Student-Presentations (combined PDF of all seven student group presentations)
Elections-Twitter-Data.twbx (Tableau workbook with data packaged. Open with Tableau Desktop, Professional Edition; will not open in Public Edition.)
DEMO.twbx (Tableau workbook with data packaged. Open with Tableau Desktop, Professional Edition; will not open in Public Edition.)