
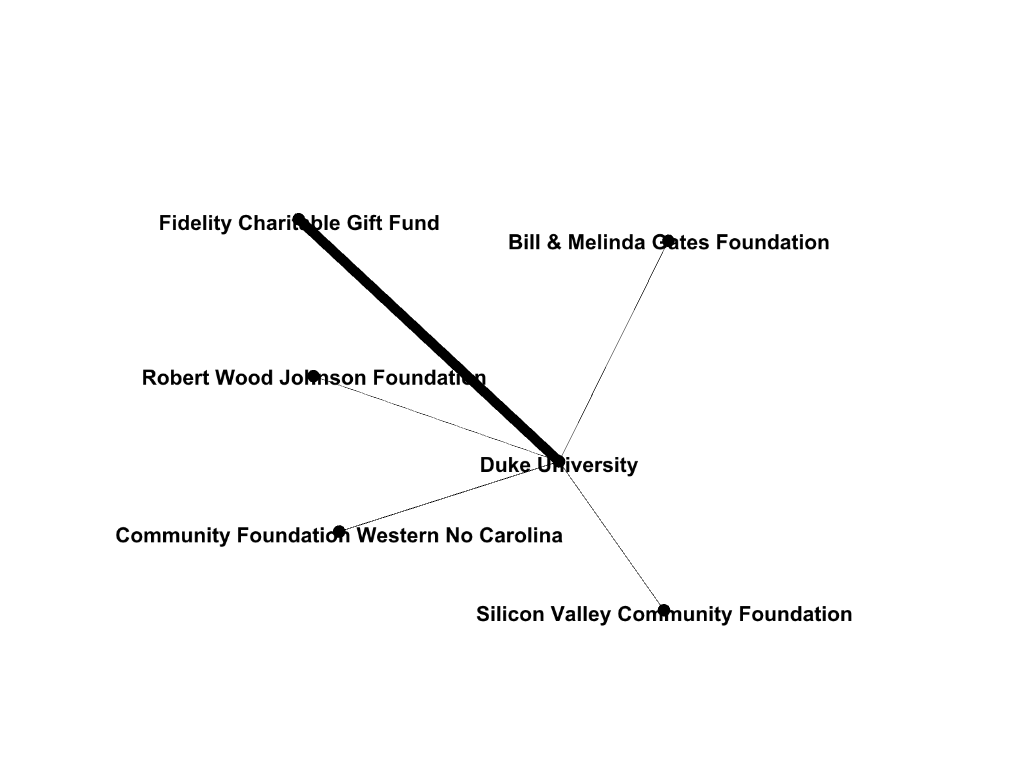
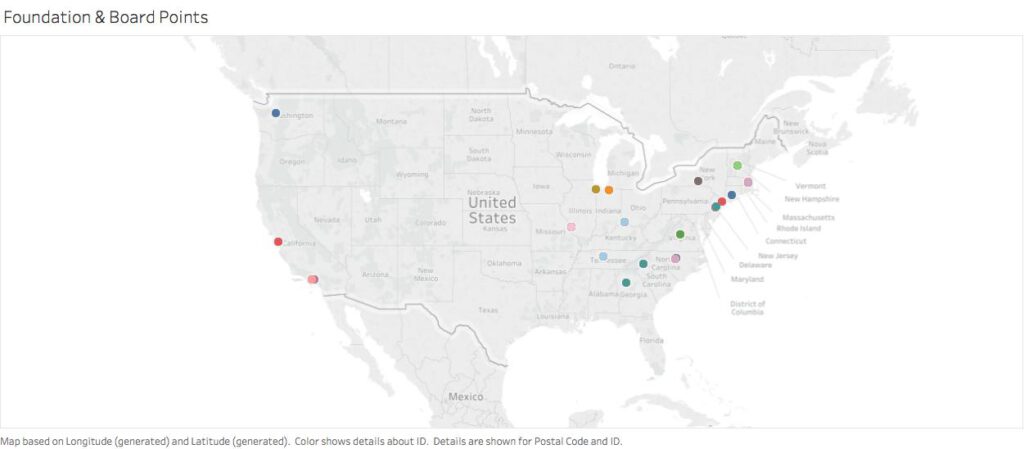
This Data Expedition introduces students to network tools and approaches and invites students to consider the relationship(s) between social networks and social imaginaries. Using foundation-funding data that was collected from the The Foundation Directory Online, the Data Expedition enables students to visualize and explore the relationship between networks, social imaginaries, and funding for higher education. The Data Expedition is based on two sets of data. The first set list the grants received by Duke University in 2016 from five foundations: The Bill and Melinda Gates Foundation, Fidelity Charitable Gift Fund, Silicon Valley Community Foundation, The Community Foundation of Western North Carolina, and The Robert Wood Johnson Foundation. The second set lists the names of board members from Duke University and each of these five foundations along with the degree granting institution for their undergraduate education. For the sake of this exercise, the degree granting institutions data was fabricated from a randomized list of the top twenty-five undergraduate institutions.
Graduate Student: Dustin D. Benac
Faculty: Dr. Astrid Giugni
Course: “One Person, One Vote—Political Representation from Aristotle to the 2016 Presidential Election” (ISS 89S; Fall 2018)
The Expedition introduces students to network visualization techniques and invites them to consider the network of individuals, organizations, and institutions that comprise the late-modern political sphere. As presented in Charles Taylor’s Modern Social Imaginaries (a course text for “One Person, One Vote”) social imaginaries reflect the historical memory, common practices that pertain to them, and the social institutions that support and sustain an interlocking web of history, practices, and social imaginaries. Despite the insight of Taylor’s work, the lack of concrete, contextual engagement in his account requires a pedagogical approach that enables students to consider the instantiations of the social phenomena he describes.
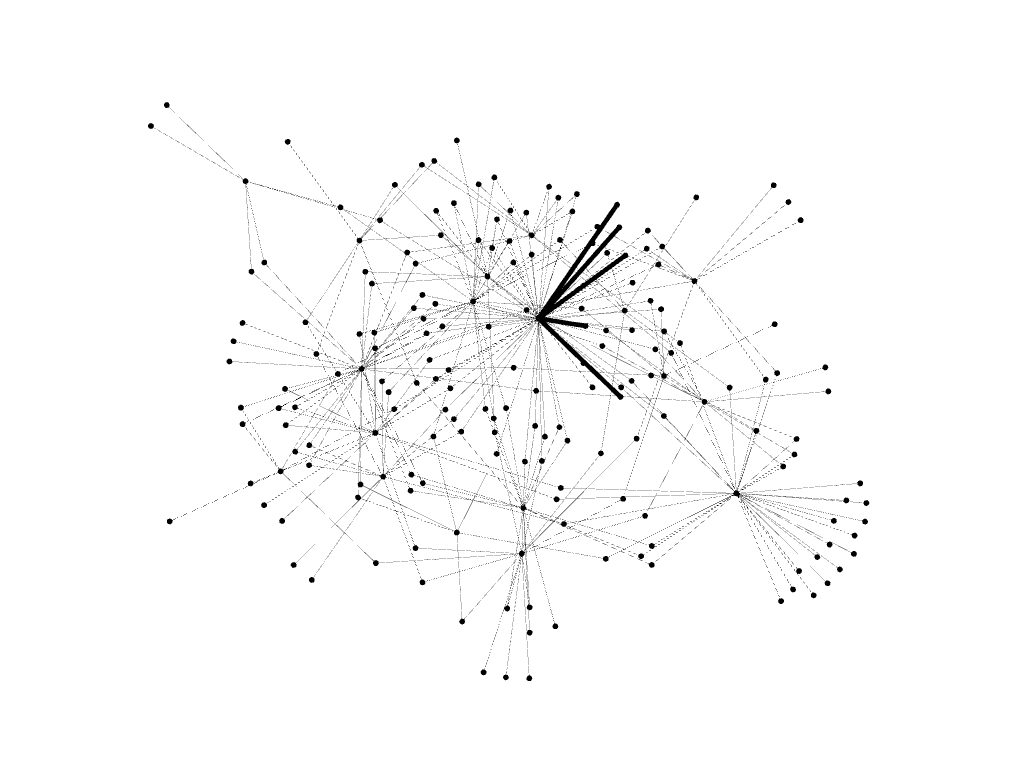
Accordingly, this Data Expedition uses these datasets as a basis for a network visualization exercise. Over the course of two sessions, students are introduced to qualitative and quantitative approaches to network analysis, develop an understanding of visualization approaches that inform network analysis, undertake a network visualization exercise based on the data, and complete a written response about the decisions they made to create their visualization and how this exercise relates to the broader course content.
The first class uses selections from Niall Ferguson’s The Square and the Tower to help students consider the prevalence of networks and the concepts (e.g. nodes, edges, strong/weak ties) that enable researchers to study the structure of networks. After an in-class discussion about different approaches to network analysis, each student completes an assignment that asks them to visualize the funding and educational network based on the funding data for Duke University two of the five foundations. In the second session, students present and discuss their visualizations. This discussion asks students to reflect on the decisions they made in developing their visualization and consider the diversity of visualizations that can come from the same data. Before the break, the class visits the Brandeleone Lab for Data and Visualization Services to introduce students to the staff and the range of resources and trainings they can consult if they want to want to use data visualization in their future research and training. The class then concludes by using Charles Taylor’s The Modern Social Imaginary to discuss the limits of network analysis and how the humanities off complementary resources for network and data-driven research.
This Data Expedition invites students to consider:
- How does the network of funding relationship that support higher education contribute to the formation of social and political imaginaries?
- Does the data demonstrate a discernable structure of formal and informal networks for funding that supports higher education?
- What forms of qualitative data may complement the available quantitative data?
- How may higher educational institutions contribute to the formation and durability of network ties that serve as channels for resources
- What are the forms of connection that represent the ties across these sites? What types of questions can a network analysis help you answer?
- What types of questions cannot be answered based on a network analysis?
- Do insights from the course materials suggest the importance of attending to a particular forms of or imbalances in social relations and influence, and, if so, how?

Downloads
Data_Benac_iiD Data Expedition Grant_Master Data (Excel)
Course materials_Benac_Ferguson_Square & Tower_Networks Section_2017 (PDF)
Course materials_Benac_iiD Data Expedition_Assignment Prompt (Word)


