A Data Expedition is an element of a course that introduces students to exploratory data analysis.
Pairs of students, often from different disciplines, work with the course instructor to formulate a question that will engage the students, and a pathway through a dataset that will provide insight.
Students are compensated for their participation once their project is completed. Browse our current projects to find opportunities.
Get Involved
Discuss projects ideas with Ariel Dawn.
Data Expeditions Projects

This data expedition focused on biological senses, in particular, musicality. The students read and summarized four scientific articles in discussion groups to build their background knowledge when it comes to how humans and animals use pitch and rhythm in music, language, and songs. We then had each student use headphones...
Graduate Students: Alyvia Martinez and Danae Diaz (adapted from Granger and De La Mater 2022) Sponsoring Faculty: Dr. Stephen Nowicki Undergraduate Course: Biology 268-Mechanisms of Animal Behavior Overview: Our Data Expedition focused on introducing students to the application of circular data in regard to animal navigation. Students worked in groups...
Graduate Students: Aeran Coughlin and Richard J Wong Sponsoring Faculty: Danae Diaz Undergraduate Course: Biology 290S – 3: “Biology By Design” This data expedition focused on plant communities, ecological data exploration, quantifying diversity, linear and generalized linear models, and ordination. Prior to the data expedition, students collected field data in...

The course was designed as a Data Expedition to familiarize senior-level undergraduates with data collection and analysis. We ran the course during the lab section of BIOL 546L on the topic of hair as a mammalian adaptation. Students created testable hypotheses, compared fur/hair samples between species, and graphed their group’s...
This data expedition focused on biological senses, in particular, musicality. The students read and summarized four scientific articles in discussion groups to build their background knowledge when it comes to how humans and animals use pitch and rhythm in music, language, and songs. We then had each student use headphones...

This data expedition focused on animal navigation, specifically the mechanisms by which organisms orient themselves in the direction they need to move. The students gathered their own orientation data using pill bugs, and in the process learned common experimental methods to test hypotheses about orientation, as well as statistical methods...

This project, conducted during a two-week workshop, combined data extraction from a database of early modern print materials (Early English Books Online; EEBO) with the translation of archival evidence through visualizations of networks relating to prominent figures in the trade.

In ecology and watershed sciences, large datasets often come from a variety of sources like continuous automated sensors, water grab samples, and community-collected scientific data. Overcoming these challenges is critical to explore the prevalence, persistence, and impact of degraded water quality on human society and wildlife. This project exposes students...

This data expedition focused on the mechanisms animals use to orient using environmental stimuli, the methods that scientists use to test hypotheses about orientation, and the statistical methods used with circular orientation data. Students collected their own data set during the class period, performed hypothesis testing on their data using...

Exposure to local pathogens is a significant selective pressure on the human genome: the strongest selective forces identified in modern human populations are for mutations that confer increased resistance to malaria infection. Understanding how human genetic variation impacts susceptibility to pathogens can reveal important aspects of disease biology and reveal...
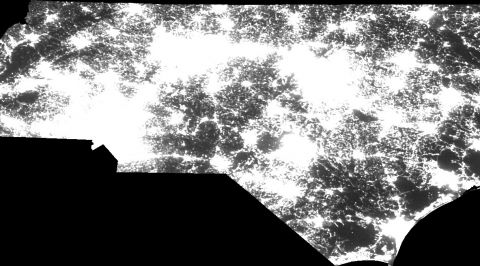
How does human habitation relate to patterns in the natural environment? How do species respond to the presence of, and changes in, habitation? In this Data Expedition, students make use of public datasets from the Census and the Global Biodiversity Information Facility to examine relationships between individual species and human...
Introduce NBA and MLB datasets to undergraduates to help them gain expertise in exploratory data analysis, data visualization, statistical inference, and predictive modeling. Graduate students: Joe Futoma and Ken McAlinn, PhD students, Statistical Science Faculty instructor: Mine Cetinkaya-Rundel Course: STA 112 (Data Science) Applications: Assessing home field advantage Determining long...
What drove the prices for paintings in 18th Century Paris? Graduate students: Hilary Cronheim and Sandra van Ginhoven, Duke Art, Law and Markets Initiative-DALMI Faculty instructor: Mine Çetinkaya-Rundel Course: STA112FS Better Living Through Data Science: Exploring/Modeling/Predicting/Understanding What drove the prices for paintings in 18th Century Paris? Auction price data Visual characteristics of...
STEM education often presents a very sanitized version of the scientific enterprise. To some extent, this is necessary, but overemphasizing neat-and-tidy results and scripted protocol assignments poses the risk of failing to adequately prepare students for the real-world mess of transforming experimental data into meaningful results. The fundamental aim of...

How do people make decisions? Graduate students: Emma Wu Dowd and Jonathan Winkle Faculty instructor: Scott Huettel Course: Psychology 201 To better understand how people make decision with uncertain outcomes, a Duke neuroscience lab collected measures of economic decision making, as well as a variety of self-reported personality measures and general...
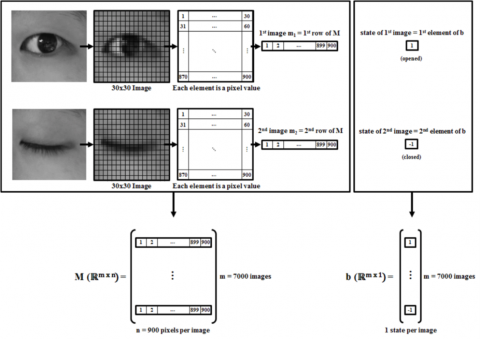
Dr. Guillermo Sapiro, professor in Pratt School of Engineering at Duke University, conducts ongoing autism research. Using image processing, he attempts to program a computer to detect whether babies (around eight to 14 months of age) display a sign of autism. This very early detection enables doctors to train these babies (when their brain...

Matt and Ken led two labs for the engineering section of STA 111/130, an introductory course in statistics and probability. The lab assignments were written by Matt and Ken in order to bridge the gap between introductory linear regression, which is often explained in terms of a static, complete dataset,...
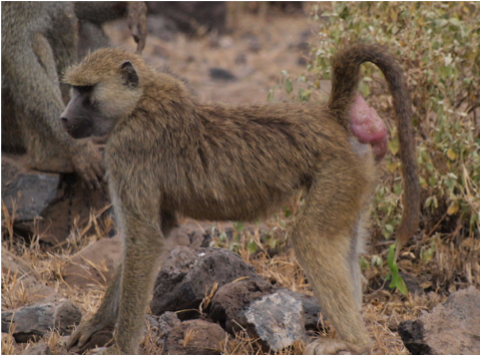
Female baboons occasionally exhibit large swellings on their behinds. Although these “sexual swellings” may evoke disgust from human on-lookers, they provide important information to group members about a female’s reproductive state. To figure out what these sexual swellings mean and whether male baboons notice, we need to look at the...
Showing 1-20 of 56 results