Large publicly available environmental databases are a tremendous resource for both scientists and the general public interested in climate trends and properties. However, without the programming skills to parse and interpret these massive datasets, significant trends may remain hidden from both scientists and the public. In this data exploration, students, over the course of three hours, accessed two large, publicly available datasets, each with greater than 4 million observations. They learned how to use R and RStudio to effectively organize, visualize and statistically explore trends in deep sea physical oceanography.
Graduate Students: Sarah Solie (Biology) and Arielle Fogel (University Program in Genetics and Genomics, Evolutionary Anthropology)
Faculty Member: Dr. Kate Thomas
Course: Biology 190: Life in the Deep Sea
Students gained experience exploring patterns in multivariate oceanographic data, relevant to their coursework, to answer the following four questions:
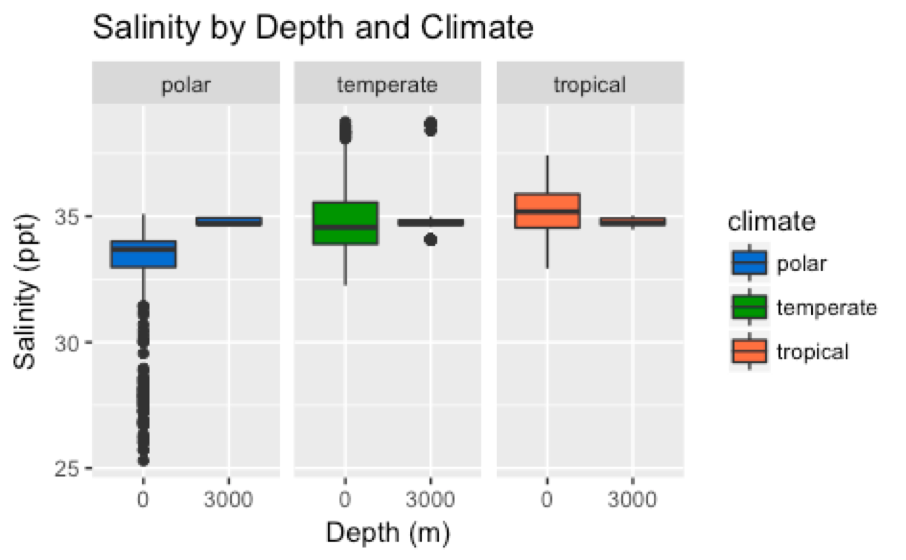
- How does average temperature and salinity at the surface of the ocean compare to the temperature and salinity at 3000 meters below the surface?
- Do the trends observed in question 1 differ across tropical, temperate, and polar climates?
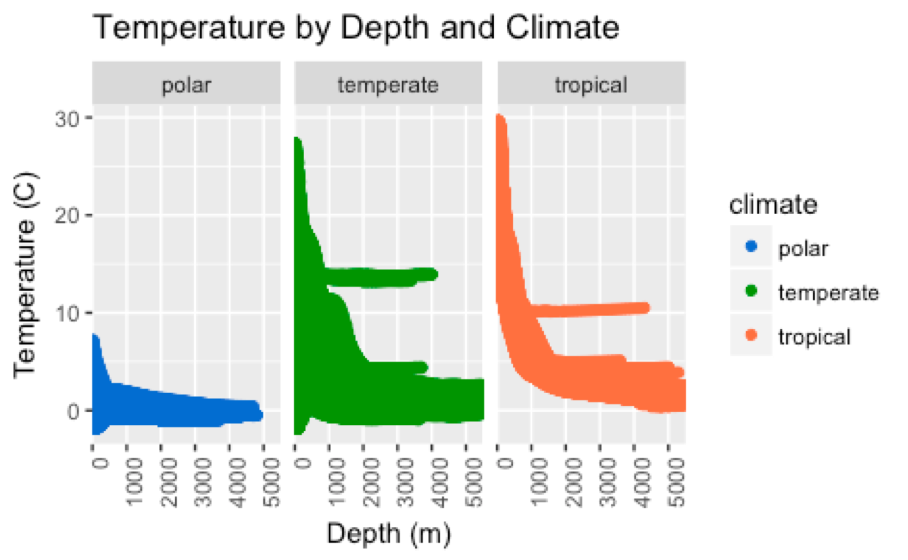
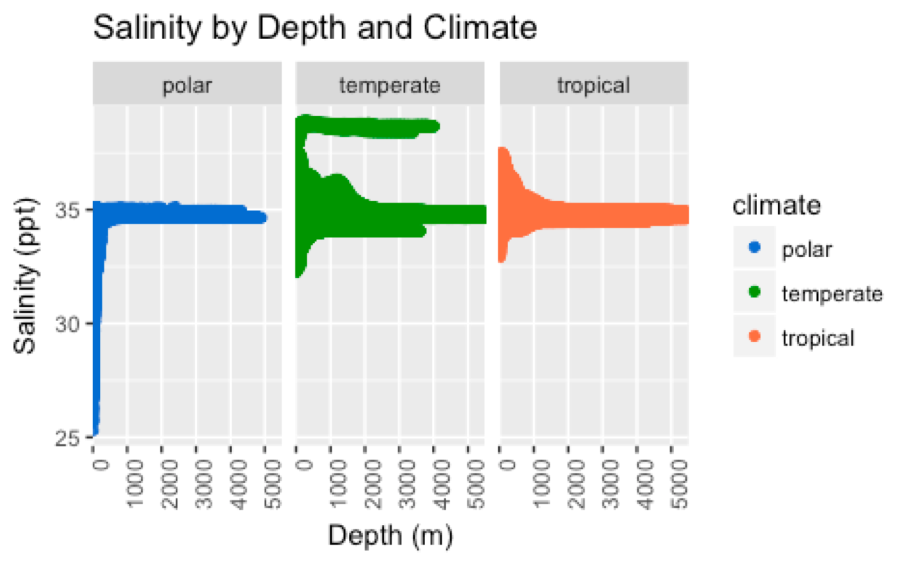
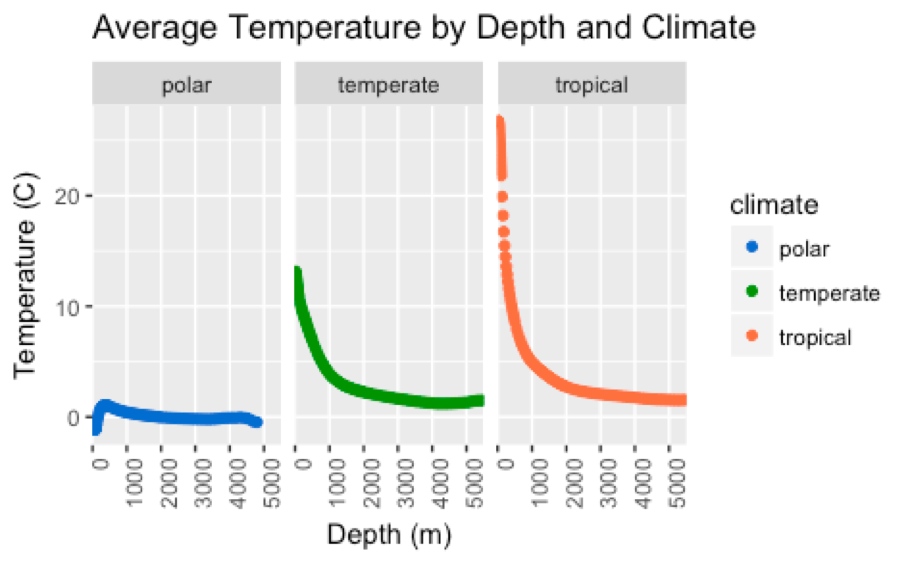
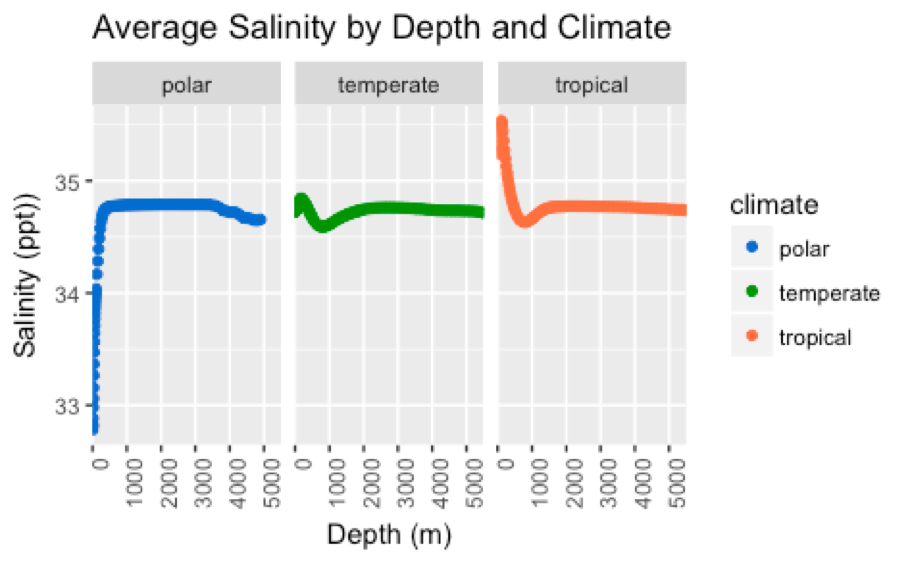
- What is the relationship between ocean temperature and salinity across depths ranging continuously from the surface to 5500 meters below sea level?
- Do the trends observed in question 2 differ across tropical, temperate, and polar climates?
As students pursued these questions, they were introduced to R, a free software program that provides powerful tools for statistical computing and graphics, and RStudio, an integrated development environment frequently used for easier programming in R. They learned valuable skills for future data analysis, including:
- Accessing and downloading two physical oceanography databases (salinity and temperature) from the National Oceanic and Atmospheric Administration (NOAA) and National Oceanographic Data Center (NODC) World Ocean Atlas 2013 – https://www.nodc.noaa.gov/OC5/woa13/woa13data.html
- Importing and inspecting a dataset in .csv format in RStudio
- Installing and using R packages
- Tidying data such that it was interpretable for R analysis
- Manipulating data included subsetting, filtering, transforming, and summarizing data
- Creating a new categorical variable and assigning values to it based on existing data
- Using graphical visualization (see Graphics Created) including:
- Boxplots (Figures 1-2)
- Scatterplots (Figures 3-6)
- Performing statistical tests including:
- A two sample t-test
- Best practices for data wrangling and analysis (e.g. inspecting data after manipulation, annotating code)
At the end of the exercise, students were provided with additional online resources to continue exploring data with R and RStudio.
The Datasets
Students accessed and explored two massive datasets from the National Oceanic and Atmospheric Administration (NOAA) and National Oceanographic Data Center (NODC) World Ocean Atlas 2013. Specifically, they used the annual temperature statistical mean and the annual salinity statistical mean datasets which contained temperature or salinity observations, respectively, across depth (up to 5500 meters), location (at 1o spatial resolution), and time (1955-2012).
Graphics Created

Course Materials
Please see the R Markdown file titled deep_sea_data.Rmd as well as the PDF version, which includes figures, titled deep_sea_data.pdf.
Student Feedback
“I learned that programming is probably 10% writing out the code and 90% figuring out what went wrong. It is a ton of troubleshooting, and through that troubleshooting is a lot of frustration. However, it was also a lot of fun doing it. Problem solving has always been enjoyable for me, so I had a good time figuring out what I did wrong.”
“It was … cool learning all of the different manners in which you can analyze data using the program and also compile all of the information—over 4 million data points—into very easy to read graphs that made interpreting the data very simple.”
“I think it was an amazing experience to make 4 million data [points] into [a] few intuitive graphs.”
“Using the skills I learned in these lessons, I can convey a huge group of data that seems chaotic into a series of tables that [are] both easy to see and easy to analyze.”
“I can understand why and how to use the codes with the instruction of the teachers.”
“Coding [in R] made it easier to graph complicated scientific results with many variables that programs like Excel would struggle with.”
Data Sources
- Locarnini, R. A., A. V. Mishonov, J. I. Antonov, T. P. Boyer, H. E. Garcia, O. K. Baranova, M. M. Zweng, C. R. Paver, J. R. Reagan, D. R. Johnson, M. Hamilton, and D. Seidov, 2013. World Ocean Atlas 2013, Volume 1: Temperature. S. Levitus, Ed., A. Mishonov Technical Ed.; NOAA Atlas NESDIS 73, 40 pp.
- Zweng, M.M, J.R. Reagan, J.I. Antonov, R.A. Locarnini, A.V. Mishonov, T.P. Boyer, H.E. Garcia, O.K. Baranova, D.R. Johnson, D.Seidov, M.M. Biddle, 2013. World Ocean Atlas 2013, Volume 2: Salinity. S. Levitus, Ed., A. Mishonov Technical Ed.; NOAA Atlas NESDIS 74, 39 pp.