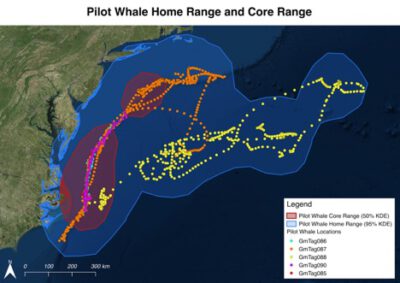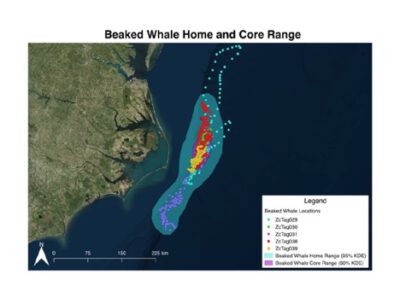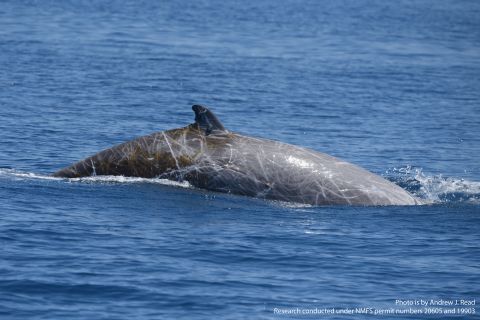
We introduced students to spatial analysis in QGIS and R using location data from two whale species tagged with satellite transmitters. Students were given satellite tracks from five Cuvier’s beaked whales (Ziphius cavirostris) and five short-finned pilot whales (Globicephala macrorhynchus) tagged off the North Carolina coast. Students then used RStudio to calculate two metrics of these species’ spatial ranges: home range (where a species spends 95% of its time) and core range (where a species spends 50% of its time). Next, students used QGIS to visualize the data, producing maps that displayed the whales’ tracks and their ranges.
Graduate Students: Amanda Lohmann, Ph.D., Student in Ecology, and Ann-Marie Jacoby, Ph.D., Student in Marine Science and Conservation
Faculty: Dr. Andrew Read
Course: “Marine Mammals” (BIOLOGY 376LA; 2018)
Data Description
The dataset consists of series of location points recorded from satellite tags on five short-finned pilot whales and five Cuvier’s beaked whales. The whales were tagged off Cape Hatteras, NC between 2014 and 2016 as part of a joint effort between Duke University and the US Navy Marine Species Monitoring Program (Deep Divers and Satellite Tagging Records).
Class Summary
We gave a brief overview of the ARGOS satellite system and issues involved in cleaning up the error-prone data that is recorded by ARGOS satellite tags. We introduced the concept of geographic information system (GIS) software used for geospatial analysis. We discussed the need to project three-dimensional spatial data from the Earth’s surface onto two-dimensional planes for analysis in GIS software and explained the importance of consistently using the same projection within a single project.
We then presented the whale track data and explained the concept of home ranges and core ranges. Next, we gave students the instructions sheet, which walked them through calculating home range and core range for both species of whale. The assignment asked students to: use the open-source QGIS program to load satellite-recorded whale locations; project the 3D latitude-longitude coordinates onto a 2D plane; export the projected coordinates into a file that could be loaded with the R programming language; use R to calculate the home range and core range of each species using a method known as kernel density estimation (KDE); transfer the resulting polygons back into QGIS; and create clear, easy-to-read maps in QGIS displaying the whales’ tracks and their ranges.
Assignment
- Create two maps in QGIS one for short-finned pilot whales (Globicephala macrorhynchus) and one for Cuvier’s beaked whales (Ziphius cavirostris) displaying the track points, core range, and home range for all animals using kernel density estimations in R.
- Descriptively compare pilot whale and Cuvier’s beaked whale home ranges by completing the following:
- Describe the two species’ home ranges and core ranges.
- Compare the two species’ home ranges (similarities and differences), and
- Give possible reasons as of to why there are similarities and differences between the two species’ home ranges. Think about their physiology, diet, behavior, etc., as well as the continental shelf and Gulf Stream.
We expect a paragraph but no more than one page. Please cite the sources you use.
Course Materials
- Thorne LH, Foley HJ, Baird RW, Webster DL, Swaim ZT, Read AJ (2017) Movement and foraging behavior of short-finned pilot whales in the Mid-Atlantic Bight: importance of bathymetric features and implications for management. Mar Ecol Prog Ser 584:245-257. https://doi.org/10.3354/meps12371
- Stanistreet, JE, Nowacek DP, Baumann-Pickering S, Bell JT, Cholewiak DM, Hildebrand JA, Hodge LEW, Moors-Murphy HB, Van Parijs SM, Read AJ. 2017. Using passive acoustic monitoring to document the distribution of beaked whale species in the western North Atlantic Ocean. Canadian Journal of Fisheries and Aquatic Sciences.
Visualizations