The Middle Passage, the route by which most enslaved persons were brought across the Atlantic to North America, is a critical locus of modern history—yet it has been notoriously difficult to document or memorialize. The ultimate aim of this project is to employ the resources of digital mapping technologies as well as the humanistic methods of history, literature, philosophy, and other disciplines to envision how best to memorialize the enslaved persons who lost their lives between their homelands and North America. To do this, the students combined previously-disparate data and archival sources to discover where on their journeys enslaved persons died. Because of the nature of data itself and the history it represents, the team engaged in on-going conversations about various ways of visualizing its findings, and continuously evaluated the ethics of the data’s provenance and their own methodologies and conclusions. A central goal for the students was to discover what contribution digital data analysis methods could make to the project of remembering itself.
The group worked with two datasets: the Trans-Atlantic Slave Trade Database (www.slavevoyages.org), an SPSS-formatted database currently run out of Emory University, containing data on 36,002 individual slaving expeditions between 1514 and 1866; and the Climatological Database for the World’s Oceans 1750-1850 (CLIWOC) (www.kaggle.com/cwiloc/climate-data-from-ocean-ships), a dataset composed of digitized records from the daily logbooks of ocean vessels, originally funded by the European Union in 2001 for purposes of tracking historical climate change. This second dataset includes 280,280 observational records of daily ship locations, climate data, and other associated information. The team employed archival materials to confirm (and disconfirm) overlaps between the two datasets: the students identified 316 ships bearing the same name across the datasets, of which they confirmed 35 matching slaving voyages.
The students had two central objectives: first, to locate where and why enslaved Africans died along the Middle Passage, and, second, to analyze patterns in the mortality rates. The group found significant patterns in the mortality data in both spatial and temporal terms. At the same time, the team also examined the ethics of creating visualizations based on data that were recorded by the perpetrators of the slave trade—opening up space for further developments of this project that would include more detailed archival and theoretical work.
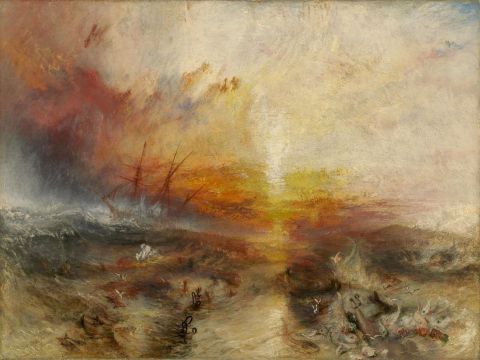
Image credit: J.M.W. Turner, Slave Ship, 1840, Museum of Fine Arts, Boston (public domain)
Faculty Lead: Charlotte Sussman
Project Manager: Emma Davenport