This Data Expedition seeks to introduce students to statistical analysis in the field of international development. Students construct a index of wealth/poverty based on asset holdings using four datasets collected under the umbrella of the Living Standards Measurement Survey project at the World Bank. We selected countries to represent different continents with comparable and recent survey data: Bulgaria (2007), Tajikistan (2009), Tanzania (2010-2011), and Panama (2008).
First, we construct an index of wealth based on household assets in the different countries using Principle Components Analysis. Once a poverty index is constructed, students seek to understand what the main drivers of wealth/poverty are in different countries. We include variables for health, education, age, relationship to the household head, and sex. Students then use regression analysis to identify the main drivers of poverty in different countries.
Graduate Students: Claire Le Barbenchon (claire.lebarbenchon@duke.edu) and Federico Ferrari (federico. ferrari@duke.edu)
Faculty: Mine Çetinkaya-Rundel
Course: STA 112FS: Data Science
Guiding Questions
This project seeks to help students answer some key questions in international development: How can we get measures of poverty that do not involve income? What are some of the demographic and human capital variables that can help explain wealth levels?
In developing countries, income may not be an ideal measure of well-being. In agricultural societies, income is tied to harvest, and thus is sensitive to the season in which the survey is administered. Furthermore, income often does not capture in-kind revenue, and is a particularly poor measure for households that practice subsistence agriculture. For this reason, development experts will often use indices of poverty based on household assets, to better understand well-being levels. Household asset ownership does not vary seasonally, and is not tied to payment-type, making it a more stable and often preferred measure of poverty.
Conceptual and Statistical Questions:
- Why we may want to create a poverty or wealth index?
- How to use Principal Component Analysis (PCA) to construct indices
- How to interpret PCA results and compare across countries
- Using regression to understand the factors that affect wealth across countries
- Using and interpreting interaction terms
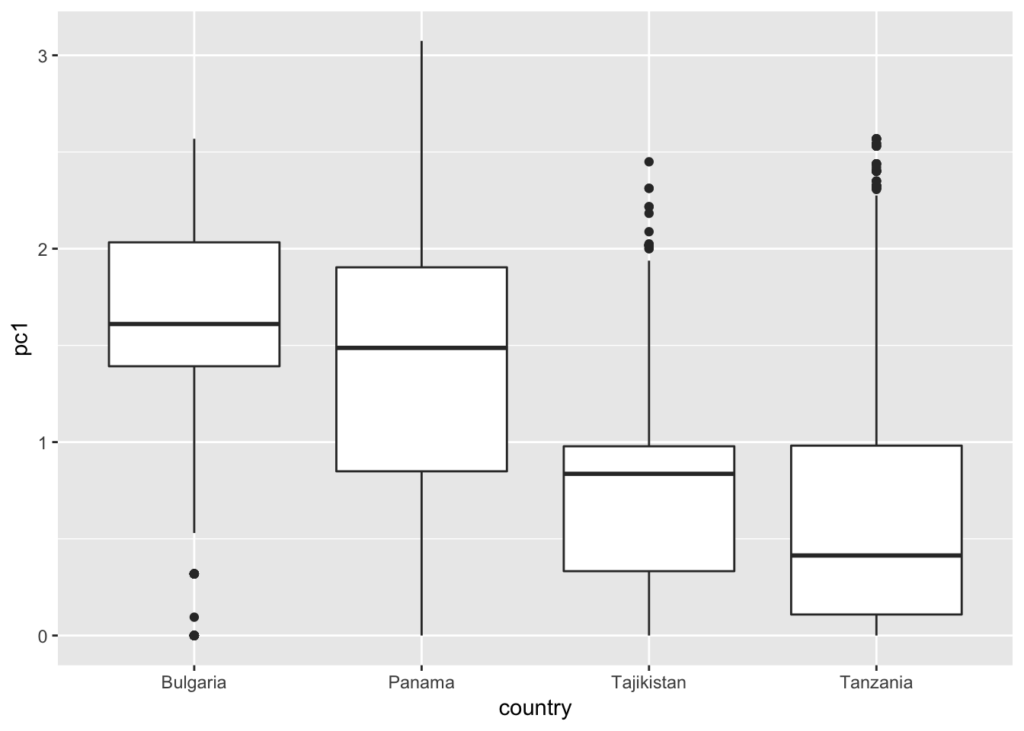
The plots below show the distribution of wealth in each of the four countries. They can be used to answer descriptive questions about inequality.

Data
All the data sets used in this project were collected under the umbrella of the Living Standards Measurement Survey project at the World Bank. This large initiative has collected survey data from developing countries since the 1980s (using comparable survey instruments) to better understand questions of health, education, poverty, employment and other indicators of well-being around the world.
While this data is public use, individuals must register and download the data at http://microdata.worldbank. org/index.php/catalog/central
We created a simplified data set for instructional purposes, randomly selecting 2,500 observations, in order to make sure that sample sizes were uniform across countries.
Dimensions of the dataset are 2,500 observations per country, for 4 countries, and 20 variables including: an ID variable for the individual and the household; and a country variable; the following demographic variables: age, gender, marital status, relationship to household head; education; a health proxy variable (hospitalization in past 12 months); water access; and ten household assets (refrigerator, tv, bike, motorbike, computer, car, video, stereo, stove, sewing machine). Thus the full dimensions are 10,000×20, including the variable for the country.
Bibliography
The World Bank, Living Standards Measurement Study LSMS (2007). Bulgaria Multitopic Household Survey 2007 [BGR_2007_MTHS_v01_M]. Retrieved from http://microdata.worldbank.org/index.php/catalog/ 2273/study-description
The World Bank, Living Standards Measurement Study – Integrated Surveys on Agriculture (2010-2011). Tanzania – National Panel Survey 2010-2011, Wave 2 [TZA_2010_NPS-R2_v01_M]. Retrieved from http: //microdata.worldbank.org/index.php/catalog/1050
The World Bank, Living Standards Measurement Study LSMS (2008). Panama – Encuesta de Niveles de Vida 2008 [PAN_2008_ENV_v01_M]. Retrieved from http://microdata.worldbank.org/index.php/catalog/70
Tajikistan Statistical Agency, Living Standards Measurement Study LSMS (2009). Tajikistan – Living Standards Survey 2009 [TJK_2009_TLSS_v01_M]. Retrieved from http://microdata.worldbank.org/index. php/catalog/73%5Bc1%5D