Graduate student: Hamza Ghadyali
Faculty instructor: Dr. Paul Bendich
Course: MATH 412 – Topology with Applications
Highlights of Data Expedition
- Students explored daily observations of local climate data spanning the past 35 years.
- Topological Data Analysis, or TDA for short, provides cutting-edge tools for studying the geometry of data in arbitrarily high dimensions.
- Using TDA tools, students discovered intrinsic dynamical features of the data and learned how to quantify periodic phenomenon in a time-series.
- Since nature invariably produces noisy data which rarely has exact periodicity, students also considered the theoretical basis of almost-periodicity and even invented and tested new mathematical definitions of almost-periodic functions.
Summary
The dataset we used for this data expedition comes from the Global Historical Climatology Network.
“GHCN (Global Historical Climatology Network)-Daily is an integrated database of daily climate summaries from land surface stations across the globe.” Source: https://www.ncdc.noaa.gov/oa/climate/ghcn-daily/
We focused on the daily maximum and minimum temperatures from January 1, 1980, to April 1, 2015, collected from RDU International Airport.
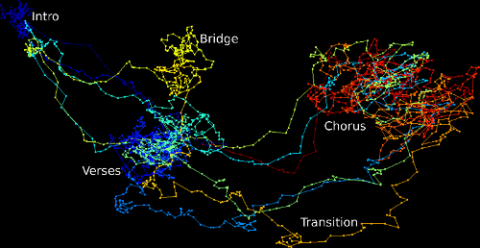
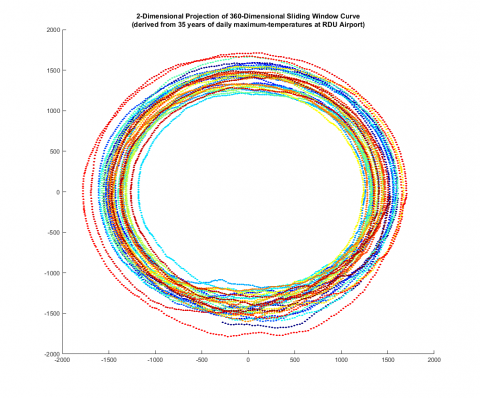
Through a guided series of exercises designed to be performed in Matlab, students explore these time-series, initially by direct visualization and basic statistical techniques. Then students are guided through a special sliding-window construction which transforms a time-series into a high-dimensional geometric curve. These high-dimensional curves can be visualized by projecting down to lower dimensions as in the figure below (Figure 1), however, our focus here was to use persistent homology to directly study the high-dimensional embedding.
The shape of these curves has meaningful information but how one describes the “shape” of data depends on which scale the data is being considered. However, choosing the appropriate scale is rarely an obvious choice. Persistent homology overcomes this obstacle by allowing us to quantitatively study geometric features of the data across multiple-scales. Through this data expedition, students are introduced to numerically computing persistent homology using the rips collapse algorithm and interpreting the results.
In the specific context of sliding-window constructions, 1-dimensional persistent homology can reveal the nature of periodic structure in the original data. I created a special technique to study how these high-dimensional sliding-window curves form loops in order to quantify the periodicity. Students are guided through this construction and learn how to visualize and interpret this information.
Climate data is extremely complex (as anyone who has suffered from a bad weather prediction can attest) and numerous variables play a role in determining our daily weather and temperatures. This complexity coupled with imperfections of measuring devices results in very noisy data. This causes the annual seasonal periodicity to be far from exact. To this end, I have students explore existing theoretical notions of almost-periodicity and test it on the data. They find that some existing definitions are also inadequate in this context. Hence I challenged them to invent new mathematics by proposing and testing their own definition. These students rose to the challenge and suggested a number of creative definitions.
While autocorrelation and spectral methods based on Fourier analysis are often used to explore periodicity, the construction here provides an alternative paradigm to quantify periodic structure in almost-periodic signals using tools from topological data analysis.