This data expedition focused on the mechanisms animals use to orient using environmental stimuli, the methods that scientists use to test hypotheses about orientation, and the statistical methods used with circular orientation data. Students collected their own data set during the class period, performed hypothesis testing on their data using circular statistics in R, and aggregated their data to formally test the hypothesis that isopods orient with light using an RShiny online application.
This exercise served as a capstone to a series of four class sessions on orientation and navigation, where students read primary scientific literature that used circular statistics in their methods. This data exercise was used to give students the opportunity to collect their own data, discover why linear statistics wouldn’t be sufficient to analyze them, and then implement their own analysis. The goal of this course was to give students a better understanding of circular statistics, with hands-on application in forming and testing a hypothesis.
Graduate students: Jesse Granger and Jason Dinh
Sponsoring faculty member: Dr. Stephen Nowicki
Undergraduate course: Biology 268 – Mechanisms of Animal Behavior
Guiding Questions
- How do animals orient with respect to light?
- How would you design an experiment to test for different kinds of orientation?
- How is circular data different than linear data?
Homework
Students were assigned homework to install R and RStudio and to learn how to navigate the interface of RMarkdown. Students learned to assign variables, code within code chunks, and use functions so that they would be prepared for the in-person R exercise.
Students also were assigned a brief reading that walked them through the differences between phototaxis and photokinesis. The goal of the reading was to encourage students to start thinking about how to analyze data, and how to design their own experiments. As such, the reading ended with two questions, the first asking them to interpret data in their own words, and the second asking them to brainstorm experimental designs to test for phototaxis.
In-Class Exercises
This expedition allowed students to develop and test hypotheses relating to animal orientation. For homework before class, students were assigned a reading that explores orientation in response to light cues and were sent a learning module that walked them through the basics of coding in R markdown.
To familiarize students with the concept, the lesson began with a brief lecture on animal orientation and linear statistics, centered around their assigned reading. Students then discussed different ways they could test an animal for phototaxis (movement towards or away from a light source).
Then, students began an experiment to test if pillbugs exhibited phototaxis. We discussed the basic life-history and biology of pillbugs, and students broke into groups to form a hypothesis on whether or not pill bugs would have phototaxis. Students hypothesized that pillbugs would exhibit negative phototaxis because they prefer damp, cold habitat.
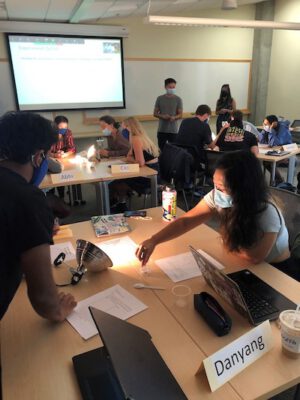
After developing hypotheses, students began the experiment. In their groups of four, the students performed the following experiment:
- Students in groups of four were each given five isopods, an orientation arena, and one lamp.
- They placed one isopod in the center of the arena under a clear plastic cup.
- They placed the lamp at the northern part of the arena and, for the “light on” experimental animals turned it on, and for the “light off” control animals left it off.
- Students then lifted the cups from the isopod and recorded the direction it was moving in when it reached the edge of the orientation arena.
- One member of each group then wrote their results on the chalkboard. We aggregated class data to test if pillbugs exhibited phototaxis.
After performing their experiments, the instructors led the group in a discussion of how to analyze their data. At this point, the concept of circular statistics was introduced once the students realized why the data they collected could not be analyzed with traditional linear statistics. We held a brief lecture on circular statistics, and led students through example code on how to plot and analyze the data they had collected in R. Students returned to their breakout groups to analyze their data while Data Expedition instructors circulated the room to provide additional programming assistance.
In the final 10 minutes of class, the Data Expedition instructors used the full class’s data to demonstrate how to use an Rshiny app that performs circular statistics. While the experimental group was significantly oriented away from the light source, the control group was also significantly oriented. While this had not been anticipated originally, it provided a valuable addition to the course material because it allowed for discussion about experimental design and including control groups.
As an “exit ticket” students were asked to show the plot and statistical tests from their group’s data, as well as interpret the results from the full class’s data in relation to their hypothesis and discuss ways to improve the experiment in the future. All of the groups had predicted the isopods would be negatively phototactic. Many students additionally suggested an improvement to the experimental set up would be closing the windows to prevent stray light from interfering with the experiment.
Resources
- Class data, with the analysis and visualizations made during class
- Pre-class reading (Granger_Dinh 2021-Photokinesis and phototaxis)
- Pre-class R markdown workbook (PDF and RMD)
- Slides presented during class
- In-class handout for the experiment
- Orientation arena used during class
- Example of the code that we did live during the class