
This data expedition focused on animal navigation, specifically the mechanisms by which organisms orient themselves in the direction they need to move. The students gathered their own orientation data using pill bugs, and in the process learned common experimental methods to test hypotheses about orientation, as well as statistical methods used to analyze circular data. The students used an RShiny application to test their hypotheses about the data they collected, and during the last 15 minutes of class we aggregated the data from all groups and used the same RShiny app to test the collective class data.
This exercise was a capstone to a series of class sessions focused on orientation and navigation. The students read primary scientific literature discussing these topics that often used circular statistics in their methods. The goals of this exercise were to give the students a better understanding of circular vs linear statistics, learn about experimental set-up, and get hands on experience with forming and testing their own hypotheses.
Graduate Students: Emily Brady and Danae Diaz (adapted from Granger and De La Mater 2022)
Sponsoring Faculty: Dr. Stephen Nowicki
Undergraduate Course: Biology 268-Mechanisms of Animal Behavior
Guiding Questions
- How do animals orient with respect to light?
- How would you design an experiment to test for different kinds of orientation?
- How is circular data different than linear data?
Homework
The students were assigned a pre-class reading on phototaxis and photokinesis to introduce them to the subject of the exercise. The homework asked the students to interpret some data in their own words, as well as brainstorm potential experimental designs to test for phototaxis, and these were discussed at the beginning of class to start the exercise off.
Classroom Exercise
This expedition allowed students to develop and test hypotheses relating to animal orientation. For homework before class, the students were assigned a reading that explores orientation in response to light cues, and experimental designs to test for phototaxis. To familiarize students with the concept, the lesson began with a brief lecture on animal orientation and linear statistics, centered around the assigned reading. Students were also asked to discuss the ideas for experimental designs they had come up with during their homework in groups. The students then were presented with the exercise set up: isopods, orientation arenas, boxes that would act as separators to keep ambient light from entering the arena, and lamps. The window shades in the room were drawn as well to lessen light pollution. In their groups, the students were then asked to form hypotheses regarding the isopods’ orientation in response to light cues. From there, the students performed their experiment, which proceeded as follows:
- Students in groups of four were given six isopods, an orientation arena inside a box, and one lamp.
- They placed one isopod at a time in the center of the arena under an opaque plastic cup.
- They placed the lamp at the northern part of the arena, and for the “light on” group would turn it on, and for the “light off” group would leave it off.
- Students then lifted the cup from the isopod, and recorded the direction it was moving when it reached the edge of the orientation arena.
- Students then repeated this five times, for a total of three “light on” and three “light off” trials.
- One member of each group then wrote their results on the whiteboard.
From there, we had the students discuss ways to analyze the data based on the lecture we had presented earlier on linear statistics. At this point, we introduced the concept of circular statistics and why it was more appropriate in this circumstance with a brief lecture on the topic. We also showed the students the circular statistics RShiny app, and demonstrated how to use it, and what each of the calculated statistics meant. The students then returned to their groups and analyzed their own data using the RShiny app while the instructors walked around providing assistance.
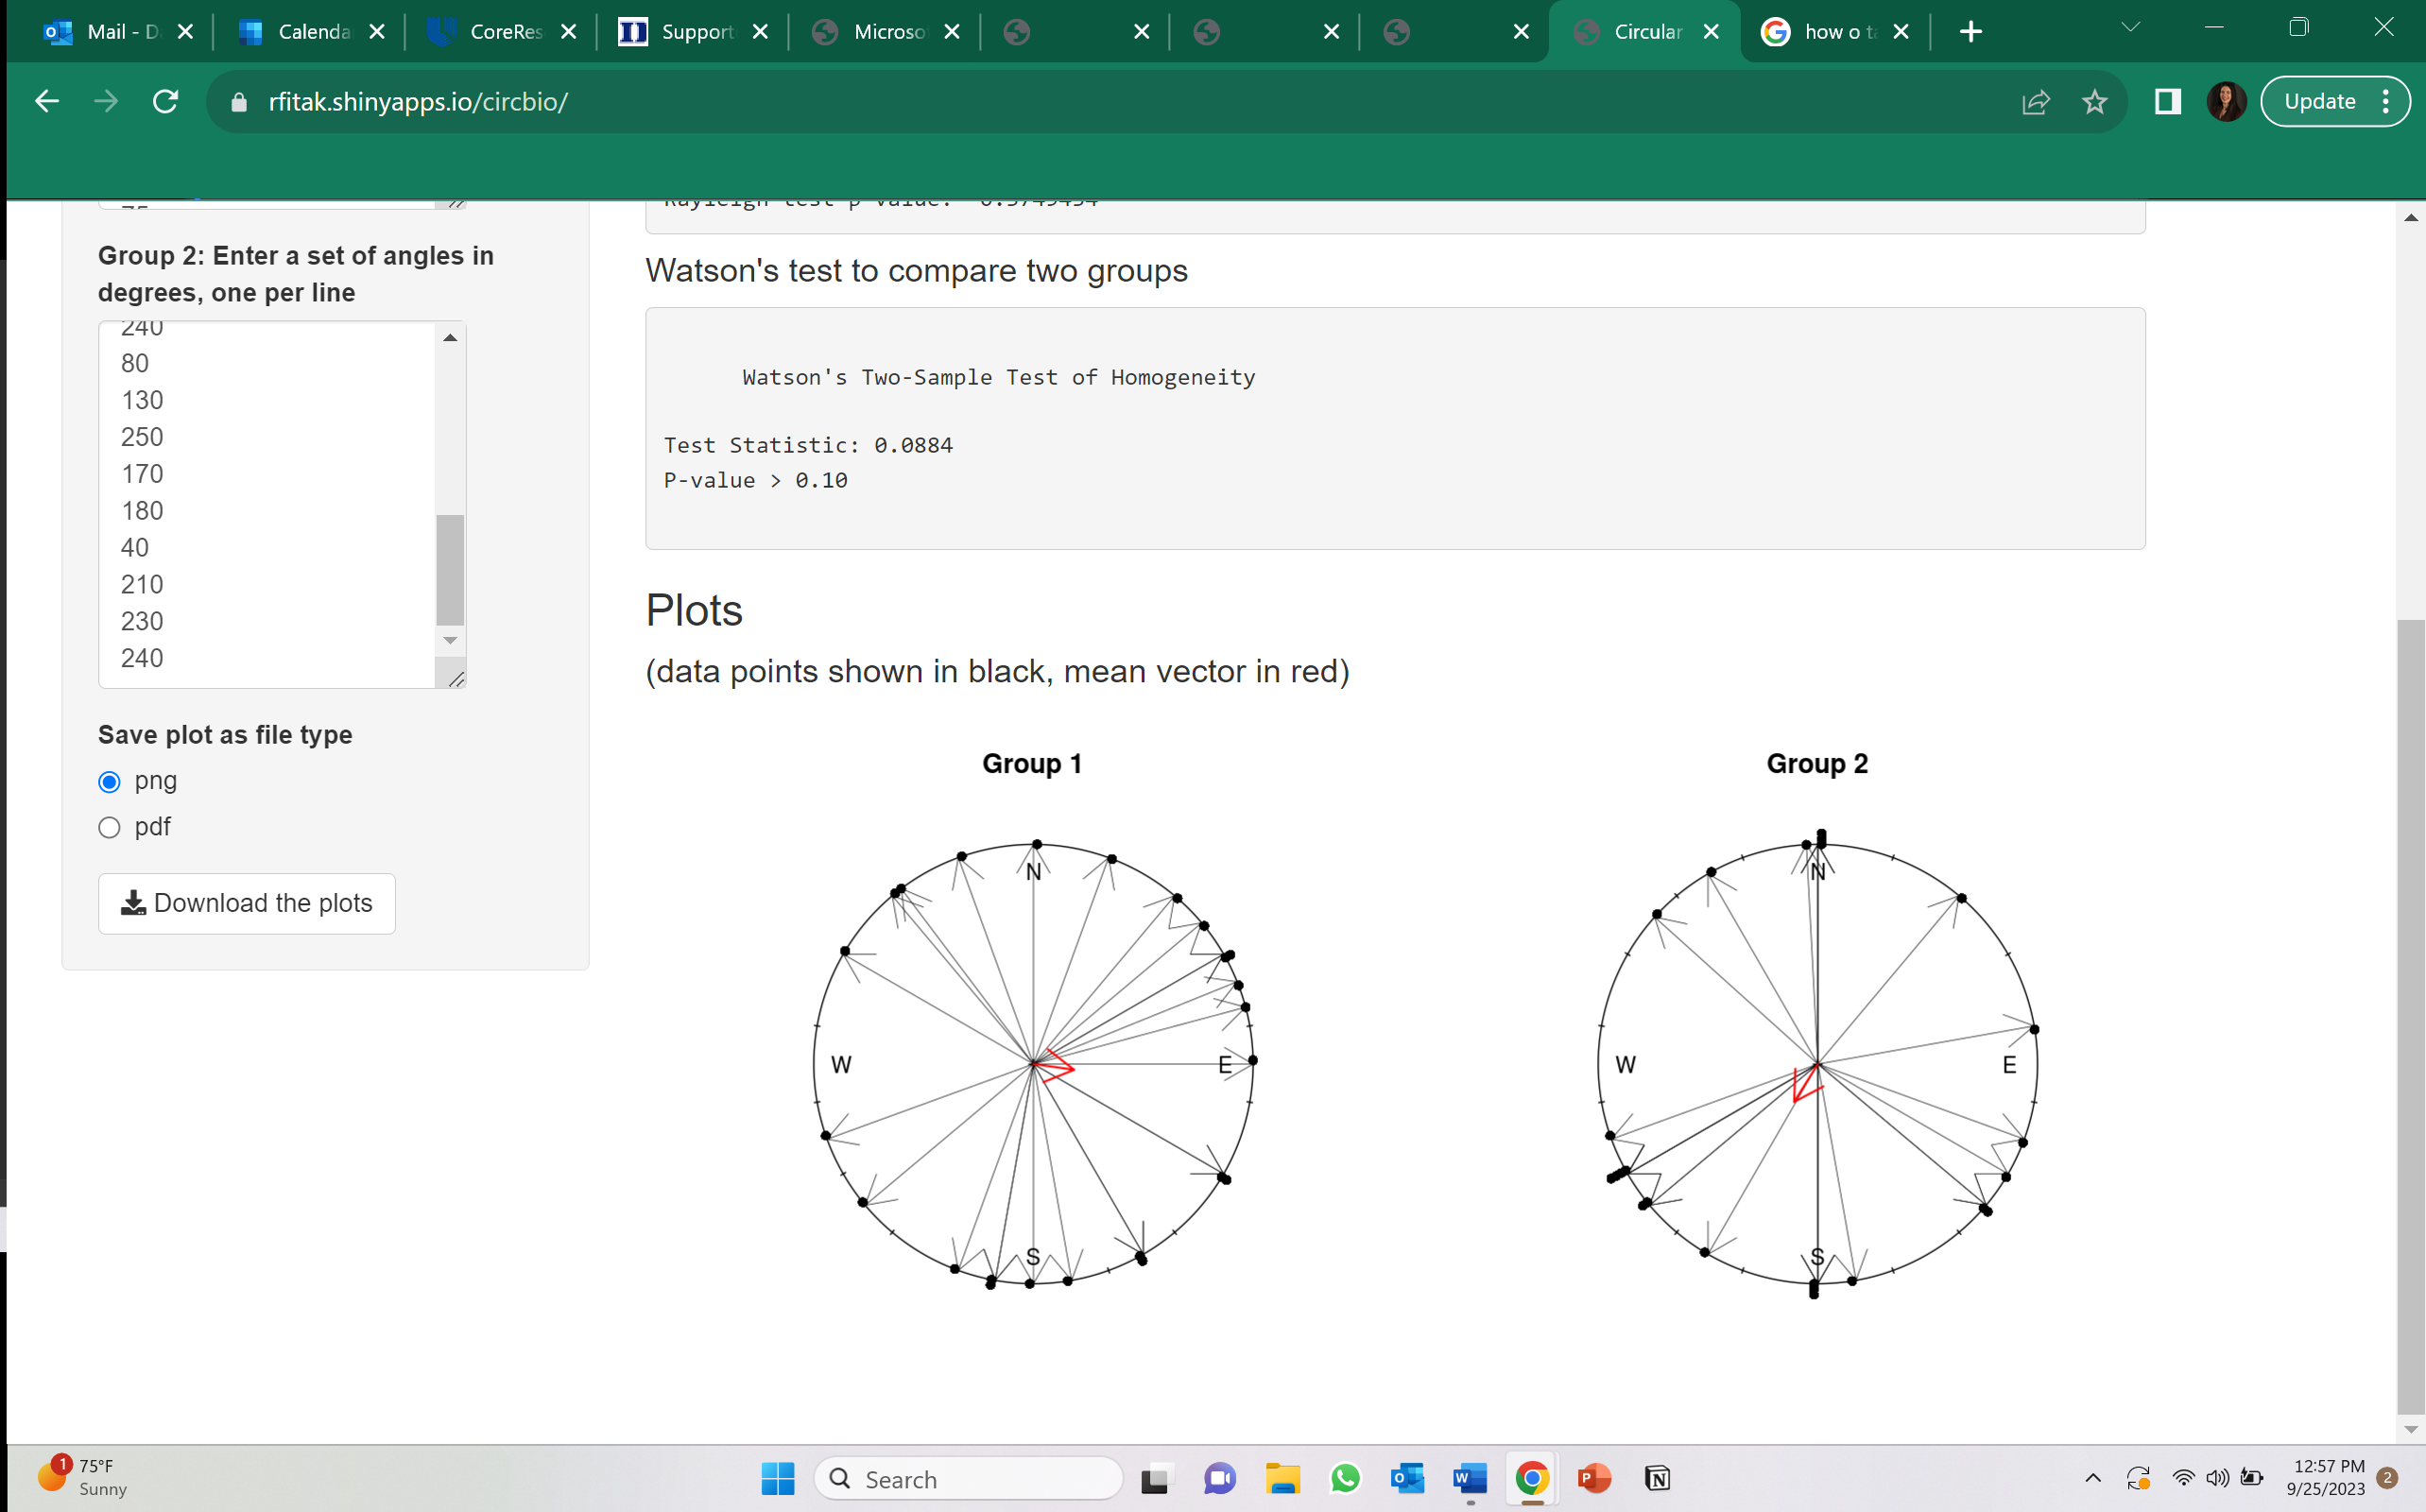
After each group had analyzed their data individually, we came together as a class and used the RShiny app to analyze the combined group data. The students were then asked to discuss how the data related to their hypotheses. Most of the class had hypothesized that the isopods would be negatively phototactic, meaning that they would turn from the light, since their usual habitat is dark, damp spaces such as under rocks. Our combined class data however showed a much larger spread of directions, with no statistically significant orientation direction for either the experimental or control groups, which was unexpected, and showed that perhaps there were some unaccounted for factors affecting the experiment. We then had the students discuss what factors they think could have accounted for the found results, and asked them to come up with ways to trouble-shoot these factors if they were to run the experiment again. Some of the things they came up with included the fact that maybe there was still some light pollution getting into some of the boxes, maybe the isopods weren’t given enough time to adjust under the cup after being picked up and handled, and perhaps some of them weren’t quick enough in removing the cup, thus casting a shadow over the animal and scaring it in one direction or the other. All of these factors will be taken into consideration for the next iteration of this exercise, such as randomizing the direction from which the cup is lifted, having the box open from the top instead of the side, or bringing in room darkening curtains or cloth to block out as much sunlight as possible.
As an exit ticket, the students were asked to send their plots and statistics from their individual groups to the instructors.
Resources
- Full class data (screenshot 1, screenshot 2), along with individual group graphs/data (Pillbug Experiment Data from Students.pdf)
- The following class material:
- The pre-class reading (Granger _ De La Mater 2022 – Photokinesis and Phototaxis.pdf)
- The slides presented during class (Phototaxis-in-Pillbugs2023.pdf)
- The in-class handout for the experiment (PillbugOrientationLab_Instructions-2022.pdf)
- The orientation arena used during class (Orientation-Arena.pdf)

