This Data Expedition introduced hypothesis-driven data analysis in R and the concept of circular data, while providing some tools for importing it and analyzing it in R.
After exploring a simple dataset to learn these tools, we applied what we learned to two real examples of circular datasets: one testing for magnetoreception in salmon (based on Putman et al. 2014), and the other testing for visual orientation in deep-sea squids (Thomas et al. 2017). The lesson was designed to be a code after me, step-by-step journey through data analysis for undergraduate students.
Graduate Students: Julia Notar and Katie Thomas
Faculty: Tom Mitchell-Olds
Course: Bio 304, Biological Data Analysis
This lesson was done entirely in R, an open-source, free programming environment, and provided a rich opportunity for teaching students to explore, manipulate, and statistically analyze data using R and connect it to biological principles and questions. We did this through the introduction and analysis of circular datasets. Circular data is data that indicates an angular orientation (for example, which way an animal is facing or moving, which can be measured in degrees or radians) or a periodic event (for example, circadian rhythms). We took students from raw biological data to publication-quality figures and statistical analyses to demonstrate the broad applications of computing software and the benefits of learning a flexible, open-source programming language.
After an introduction to circular data, students were presented with two different datasets to address two different biological questions using similar circular data analyses.
- Do salmon use an inherited magnetic map to navigate using the Earth’s magnetic field?
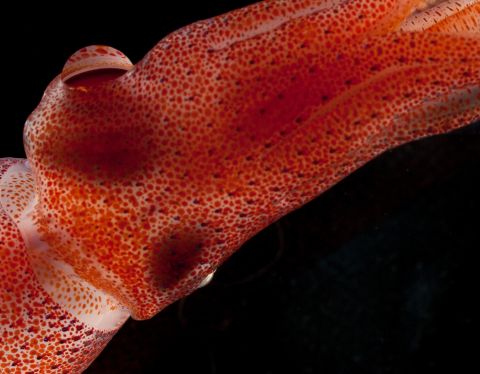
- Do cockeyed squids orient their different sized eyes in different directions to look at different light sources?
Datasets
The first dataset is a transformation (for copyright purposes) of the results of an experiment testing the effect of varying magnetic fields on juvenile salmon orientation (Putman et al. 2014). It contains the results of two experimental treatments and one control treatment, each in a column, with rows indicating the circular orientation (in degrees) of each juvenile salmon in the experiment. The data are from a published study on how naïve juvenile salmon navigate hundreds to thousands of kilometers to feeding areas, and support the hypothesis that salmon use magneto-reception to help in migrations.
The second dataset is raw data on in situ visual orientation among deep-sea cockeyed squids (Thomas et al. 2017). The measurements come from 30 years of deep-sea video data that were analyzed for squid eye orientations. Columns indicate the species, left eye orientation, and right eye orientation for each individual squid measured. The data are from a published study on the functions of different sized eyes in cockeyed squids, and support the hypothesis that the larger left eye looks upward toward dim, downwelling sunlight and the smaller right eye looks downward for flashes of bioluminescence.
Class Format
We designed this to be a first introduction to circular data analysis in R. We chose to use two different datasets so that students could first be led through data import, sub-setting, transformation, plotting, and statistical analysis by the instructors. Students are given only the data files at the beginning of class, and then are walked through coding and structuring analyses by the instructor. Then, we ask them to apply these methods and skills to a different dataset answering a completely different biological question on their own.
Student Feedback
“Very clear explanations of why circular data needed to be treated differently”
“They were really understanding of our knowledge of R, but also really helped out in letting us know other features of R and Data Analysis that the class may not have explored”
“The explanations were very thorough and helped me truly understand what I was doing when I started to write the code on my own”
“The pace was good! Really appreciated both lecturers who repeated things over and over so we could follow along!”
“It was helpful getting to use some of the programming language in a different style of questions”
“Very interesting to learn about circular data”
“I thought the lectures were very interesting, applicable, and well-taught!”
Sources
Putman, N. F., M. M. Scanlan, E. J. Billman, J. P. O’Neil, R. B. Couture, T. P. Quinn, K. J. Lohmann, and D. L. G. Noakes. 2014. An inherited magnetic map guides ocean navigation in juvenile pacific salmon. Curr. Biol. 24:446–450. Elsevier Ltd.
Thomas, K., B. Robison, and S. Johnsen. 2017. Two eyes for two purposes: in situ evidence for asymmetric vision in the cockeyed squids Histioteuthis heteropsis and Stigmatoteuthis dofleini. Philos. Trans. R. Soc. B-Biological Sci. 372:20160069.