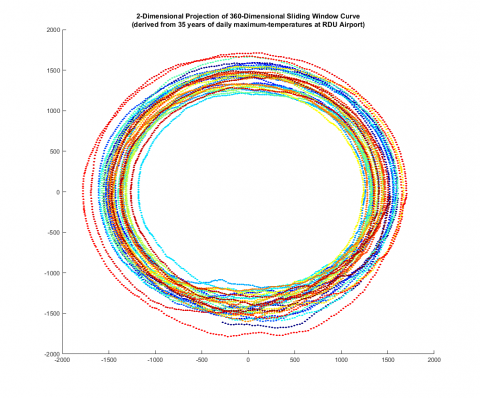
This data expedition introduced students to “sliding windows and persistence” on time series data, which is an algorithm to turn one dimensional time series into a geometric curve in high dimensions, and to quantitatively analyze hybrid geometric/topological properties of the resulting curve such as “loopiness” and “wiggliness.”
Graduate student: Chris Tralie
Faculty instructors: Paul Bendich and Lisa Huettel
Course: Math 412
Students in this Data Expedition project:
- Learned a 1D time series analysis technique for complex data
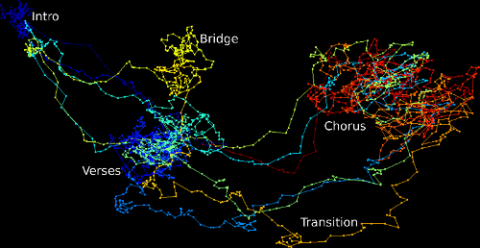
- Used the “Loop Ditty” software Chris Tralie created to visualize geometric curves that represent the music, projected down to 3D
- Were able to quantitatively analyze where vocals occurred in music by looking at loops, and that classical music is “smoother” than rock music
- Got a safe introduction to topological data analysis techniques for analyzing the curve in its true high dimensional embedding
- Discovered trade-offs between analyzing data visually after projection and analyzing data with more abstract tools in high dimensions
In this expedition, musical audio data was the 1D time series in question, which is a fun and relatable way to explore these complicated time series analysis algorithms. Musical audio data is high dimensional (44100 samples per second), noisy, complex, and highly repetitive. It’s the repetitive nature and the global/local descriptions of music that have been of particular interest in my personal research on music information retrieval. As a result, my data expedition was more about exploring “complex data” as opposed to “big data.” Therefore, most of my efforts curating the data were directed at creating a web-based graphical user interface, which I called “Loop Ditty, which turned music into visual curves in a way that would allow students to visually explore and manipulate complex patterns in the sound that would be difficult to glean from the waveform alone. Figure 1 shows a screenshot from the LoopDitty software
In addition to visual exploration in 3D, students also used tools from topological data analysis to quantitatively analyze the musical curves in high dimensions. Their task was to make observations in both domains.