The data that students see in their statistics courses are often constrained to numeric and tabular data. However, there is an exciting field of data science and statistics known as text analysis. This expedition introduces students to the concept of treating text as data frames of words, and demonstrates how to perform basic analyses on bodies of text using R. Tweets of four Democratic candidates for the 2020 Primary are used as data, and demonstrated text analysis techniques in the expedition include comparisons of word frequencies, log-odds ratios for word usage, and pairwise word correlations.
Graduate Students: Becky Tang & Graham Tierney, Department of Statistical Science
Faculty: Maria Tackett (Sta 199); Fan Li (Sta 440)
Course: Sta 199: Introduction to Data Science and Sta 440: Case Studies in the Practice of Statistics
Overview
Sta 199
During this Data Expedition, students were introduced to the concept of text as data. We used tweets from four Democratic 2020 Primary candidates–Joe Biden, Kamala Harris, Bernie Sanders, and Elizabeth Warren–as a working dataset to demonstrate several text analysis tools. Our goal was to familiarize students with this area of data science with the hope that students would employ text analysis in their final projects. Students learned what sorts of questions one can ask of text data, such as:
- What words/phrases does Author Y use the most?
- What words are most distinctive of Author Y when compared to Author Z?
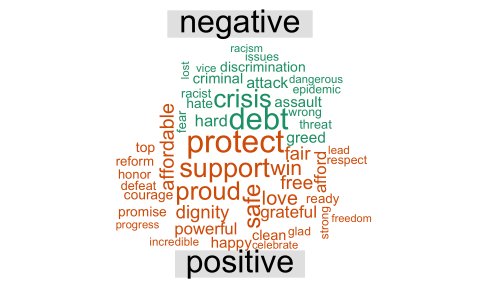
- What is the overall sentiment associated with Document X?
In order to answer these flavors of questions, we introduced the following concepts:
- Transforming text into a format suitable for statistical analyses
- Processing and cleaning text data
- Sentiment analysis
- Comparing documents by word frequencies
- Comparing authors by log-odds ratios of word usage
- Examining pairwise correlations for bi-grams
We focused on comparisons in word usage and sentiment between Biden and Warren, and along the way we also gave students examples of effective visualizations to convey the findings. Students then spent the last bit of class applying these methods to a second dataset comprised of the State of the Union addresses from Presidents Obama and Trump. Overall, the expedition exposed students to the challenges associated with text data as well as the interesting insights that can be gleaned through statistical text analyses. As a result of this expedition, some students in the course employed text analysis in their final projects.
Sta 440
We first taught this data expedition to Sta 199 students earlier in the Fall 2019 semester. However, students in Sta 440 have a stronger statistical background so we incorporated more advanced topics for this expedition. Students were introduced to the idea of text as data, and we provided two datasets to demonstrate several text analysis tools. The first dataset is comprised of tweets from four Democratic 2020 Primary candidates–Joe Biden, Kamala Harris, Bernie Sanders, and Elizabeth Warren. With this dataset, students were introduced to concepts such as sentiment analysis and comparing documents and text by word frequencies, sentiment, and log-odds of word usage.
The expedition then shifted focus to more complicated text analysis techniques of classification and topic modeling, demonstrated using transcripts from State of the Union addresses beginning with President Nixon’s 1970 address. In particular, the classification task of interest was recovering the political party from the paragraphs of a speech. We employed logistic regression using sentiment analysis as a dimension reduction tool to predict political party. Then moving away from sentiment, we introduced a bag-of-words generative model for classification using Dirichlet, Multinomial, and Dirichlet-Multinomial distributions. Students saw that these methods were able to correctly classify Republican presidents from the text, but sometimes misclassified Democratic presidents. However, classification requires labeled data and it is not always the case that labels are provided, nor does classification tell us about the content of a document. Thus, we finished the expedition by introducing topic models using the Latent Dirichlet Allocation (LDA).
This data expedition gave students an opportunity to see data analysis in action, and were encouraged them to perform text analysis for their final project.
Data
The Twitter data were scraped using the rtweet() package in R. We obtained the 1,200 most recent tweets at the time of the data expedition from Joe Biden, Kamala Harris, Bernie Sanders, and Elizabeth Warren. In addition to the author and text, other variables include each tweet’s unique identifier, the timestamp of each tweet, the type of device that posted tweet, and how many retweets and favorites a tweet garnered (as of October 2, 2019, the time of scraping). However, the analysis mainly focuses on the author and text. A benefit of this dataset is that each tweet is a complete body of text, allowing for easier identification of the sentiment in a tweet as compared to analyzing an entire book or speech. These data also demonstrates the challenge of working with short text, as tweets are constrained to 280 characters.
The State of the Union address data used during the in-class exercise were obtained from The American Presidency Project (https://www.presidency.ucsb.edu/). There are four columns in the dataset: prsident, year, a sentence from the address, and the line number of that sentence.
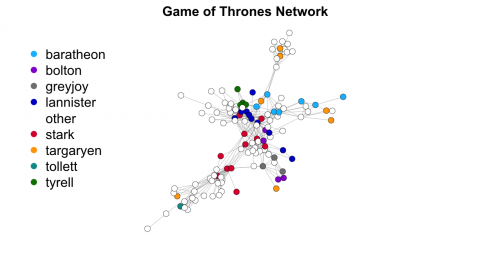
The following R packages were pre-loaded for the students: tidytext, tidyverse, stringr, scales, textdata, wordcloud, reshape2, lubridate, widyr, tidyr, igraph, and ggraph.