How does human habitation relate to patterns in the natural environment? How do species respond to the presence of, and changes in, habitation? In this Data Expedition, students make use of public datasets from the Census and the Global Biodiversity Information Facility to examine relationships between individual species and human settlements. Students develop introductory skills in spatial data manipulation and visualization in R, exposure to powerful datasets and tools, and critical thinking skills in assessing dataset quality and bias.
Graduate students: Harlan Downs-Tepper and Emily Levy
Course: Ecology for a Crowded Planet
Learning objective: Have fun with data!
- Develop and test a hypothesis or exploratory question
- Identify patterns in data and interpret them in the context of human-wildlife ecology
- Describe biases in the data, how they affect our findings, and how we could mitigate them
- Create data visualizations and tables in R and Excel
Data
For each county in NC, students had access to:
- Human population size in 2015 & 2019
- From this, you’ll calculate change in population you’ll visualize that on a map
- Citizen science reports of EVERY species in 2015 & 2019
- From this, you’ll pick your species of interest, calculate change in abundance, and visualize that on a map
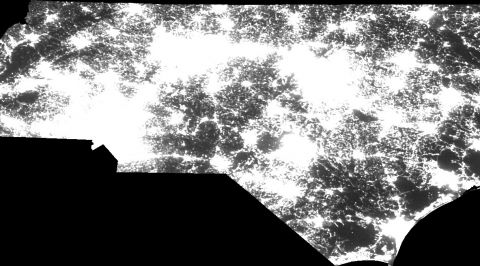
- Optional: Nighttime luminosity (light pollution) in 2015 & 2019
- From this, you’ll calculate change in luminosity and we’ll show you how visualize that on a map
Analyses
Some analyses to consider:
- Compare a map that shows change in human population vs a map that shows change in the abundance of a species, genus, or family
- Can do this for several species
- A table or two showing wildlife abundance of a few species in the fastest-growing and fastest-shrinking counties
- Scatter plot showing the correlation between variables
- Think about whether data are comparable as is, or whether you need to calculate % change and/or filter out counties with low wildlife reporting
Task for Class
- As a group, come up with a hypothesis or an exploratory question that you can address with the data at your disposal
- As a group, come up with a plan for how to test that.
- Collect your data! Everyone must do some coding!
- Reconvene, pull your data together, make any additional tables or plots, and work together to interpret your findings.
- ~2:30: Class-wide check-in to discuss the data and our findings
- Turn in a short report with the following (1 per group, due Wednesday):
- Your hypothesis or exploratory question and prediction(s) (2-4 sentences)
- Tables and figures testing your hypothesis or question
- Your interpretation of the data (4-8 sentences)
- Describe what you found and what it means.
- Options to consider in your interpretation: biases in the data, behavioral or life-history information about the species you studied, additional anthropogenic events that occurred between 2015 and 2019, remaining uncertainties, future directions
Resources
- This article about land use change and biodiversity in NC and the Triangle: https://cnr.ncsu.edu/news/2019/05/1-million-species-are-at-risk-of-extinction-heres-why-it-matters/
- Interactive map of the GBIF database: https://www.gbif.org/occurrence/map?has_coordinate=true&has_geospatial_issue=false&occurrence_status=present
- Google information about species you want to look at! Wikipedia, Audubon Society, local conservation organizations, and others will have helpful information about any species you can think of.
- 20220201 – Data Exploration – Species and People.R
- Combined dataset.Rda
- Class presentation (PPT)