Fluid mechanics is the study of how fluids (e.g., air, water) move and the forces on them. Scientists and engineers have developed mathematical equations to model the motions of fluid and inertial particles. However, these equations are often computationally expensive, meaning they take a long time for the computer to solve.
To reduce the computation time, we can use machine learning techniques to develop statistical models of fluid behavior. Statistical models do not actually represent the physics of fluids; rather, they learn trends and relationships from the results of previous simulation experiments. Statistical models allow us to leverage the findings of long, expensive simulations to obtain results in a fraction of the time.
In this project, we provide students with the results of direct numerical simulations (DNS), which took many weeks for the computer to solve. We ask students to use machine learning techniques to develop statistical models of the results of the DNS.
Graduate Students: Reza Momenifar and Jonathan Holt, Department of Civil & Environmental Engineering
Faculty: Simon Mak, Department of Statistical Science
Course: “Machine Learning and Data Mining” (STA 325)
Introduction
Statisticians and machine learning specialists are often asked to analyze data from obscure sources. No matter the source of data, analysts must be comfortable applying their skills to solve the client’s problem. This Data Expeditions course prepares students for the real world by asking students to analyze data from a field with which they have little experience: turbulent flow in fluids. Furthermore, this Data Expeditions course challenges students to interpret their results in order to gain an understanding of the behavior of fluids in turbulent flow.\
Students are first given a 1-hour lecture introducing the data. We explain that fluid dynamics is a classic field of physics pertaining to the motion of fluid particles. We discuss the concept of turbulence, a phenomenon that most people are familiar with in the context of airplane travel. Next, we explain why it is computationally expensive to model turbulence using direct numerical simulation (DNS). It would be much faster, we tell the students, if we had a statistical model of our data. We illustrate the concept of particle clustering in turbulence and explain how we employed the Voronoi tessellation analysis to identify clusters. We provide students with our dataset and ask them to return in three weeks with a proposed statistical model. Specifically, we ask students to model the first four moments of particle cluster size given three parameters: the Reynolds number, Stokes number, and Froude number.
During a two-hour follow-up session, students present their solutions to the TAs and professor. In addition to the presentation, students write a report on their findings.
Guiding Questions
- What is a fluid? How does a fluid behave?
- What is turbulence? Where do we see turbulence in our everyday lives? How particles move in turbulent flow and why they form cluster?
- What are the important properties of fluid and particles in particle-laden flows?
- Why is direct numerical simulation important for the study of turbulence and particle dispersion in turbulent flow?
- Why is direct numerical simulation expensive?
- How can machine learning reduce computation time?
- How can machine learning provide insight into the behavior of particle motion?
The Dataset
The data were collected by Reza Momenifar as part of his doctoral thesis to investigate the properties of particle clusters in turbulent flow. The dataset is extracted from many numerical simulations in 3D space, performed in Reza’s Theoretical and Computational Fluid Dynamic Group. The simulations model the distributions of particles under idealized turbulence in a cubic box. In these simulations, three independent control parameters representing the properties of turbulent flow and particles are varied. The particles’ positions and other dynamic properties of the flow fields (e.g., velocity) are stored. Next, Voronoi tessellation analysis was performed and particle clusters were identified. The particle clusters are represented by the first four moments of cluster size distributions.
In this analysis the predictor variables are the fluid and particle properties (Reynolds number, Stokes number, Froude number). The response variables are the first four moments of the cluster size distribution. The students receive a dataset with 120 observations (rows).
In-Class Exercises
Reza and Jon first presented a lecture introducing the concept of turbulence and how turbulence manifests in everyday phenomena. This lecture began with a background on the study of fluid dynamics. Then, they introduced direct numerical simulation (DNS) and explained why DNS is computationally expensive. Afterwards, they explained the Voronoi tessellation analysis and its applications, particularly in particle-clustering. Finally, Reza described how he generated the dataset that students will use for their assignment.
After Reza’s lecture, Reza and Jon gave students their assignment. Students were told that they had three weeks to develop four statistical models – one for each of the four moments – given the sample dataset.
The course (STA 325) had weekly lab sessions, which provided a natural venue for students to ask questions about the assignment. The main issue that students had was scaling the variables. The ranges of some of the predictor and response variables were quite large; therefore, students had to think critically about how to appropriately scale these variables. Regarding the models themselves, students were quite comfortable using the R programming language to develop different types of models, including linear, generalized additive, and tree-based models. The students were particularly well-suited for the assignment because they had just learned about different types of models from their regular course instruction.
Students presented their results during a two-hour presentation session. In addition to presenting their findings, students were asked to use their models to make predictions on a test set (data that includes response variables only). Students submitted their predictions to the TA’s, who determined which group had the most accurate models. Model performance was taken into account for assigning student grades on the assignment.
After the final presentations, students reflected on their experience in the Data Expeditions project. Several students noted that the Data Expedition felt like a real-life client project, similar to what they might experience at a consulting firm. Other students noted that they were able to directly apply the material learned in class to a novel dataset.
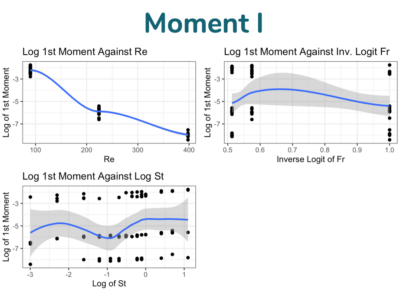
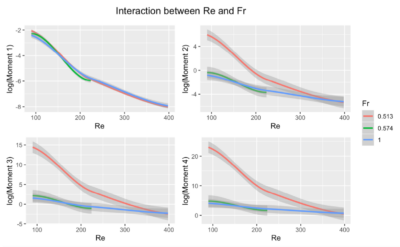
Below are images from student submissions:
Source of the Data
Momenifar, M., Bragg, A.~D.\ 2019.\ Local analysis of the clustering, velocities and accelerations of particles settling in turbulence.\ arXiv e-prints arXiv:1908.00341.
Downloads
- assignment (PDF)
- data-test (CSV)
- data-train (CSV)
- presentation_slides (PDF)
- proposal (PDF)
- rubric (DOC)
Contact
Reza Momenifar or Jonathan Holt
mohammadreza.momenifar@duke.edu or jonathan.holt@duke.edu