Ecological data comes in various shapes and sizes. When conducting an ecological study, it is common to have population data (such as snail counts) and continuous sensor data (such as stream temperature with 35,000 data points collected each year!). Ecologists must reconcile data collected at different spatial and temporal scales in order to make inferences about their study systems. Luckily, there are standard practices and toolsets that ecologists use. In this data expedition, we ingest, arrange and query data collected in the field through various methods into formats that can be analyzed. We then use different plot types, data transformations and statistical tests, such that our analyses are appropriate for the type of data. We examine both field data collected by students and also large open-source datasets that can be scraped from the web and analyzed locally.
Each year, the Field ecology students measure physical, chemical, and biological characteristics of the Eno River. The Eno River also has been continuously monitored for numerous environmental parameters as part of the StreamPulse project (Duke and other collaborators worldwide). StreamPulse collects data from instream sensors, such as temperature and dissolved oxygen to estimate ecosystem processes such as metabolism. So, we are able to compare data collected in the field course to long term monitoring efforts.
Graduate Students: Emily Ury and Alice Carter
Faculty: Dr. Justin Wright (and Dr. Emily Bernhardt helped with original proposal)
Undergraduate Course: “Field Ecology” (BIO 361)
Objectives
Part 1: Observations at the Eno River
- Students will learn how to ingest their own data into the R programming environment
- Students will become familiar with different types of ecological data
- Students will use linear regression and multiple linear regression to examine and predict ecological data
- Students will try different transformations and statistical tests to examine their data
Part 2: A Year of Eno River Data
- Students will explore the StreamPulse project data platform and R package
- Students will download and examine a year of Eno River monitoring data
- Students will begin to examine how long-term monitoring data is used to understand field observation data for ecological analysis.
Here are some examples of the plots we made:
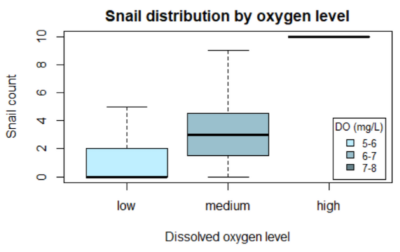
Binning stream parameters to understand population distributions
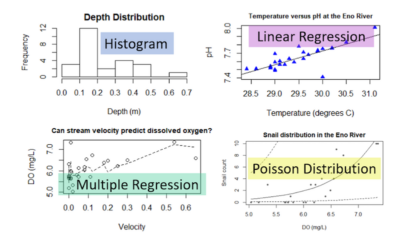
Trying out various visual, statistical and modeling approaches
Student Feedback
“I’ve never used R before, so I learned how to input data, make plots, and do regression analyses (single + multiple)…Stream data was really cool!”
“Thank you! Super helpful. Always so much to learn with R.”
“[I] learned how to fit a linear trendline to a graph.”
“I learned how to customize the data I am working with.”

Attached materials for the lesson
Two R markdown files:
- Ecology Data Analysis (zip file)
- Time Series Data Analysis (zip file)
One data file:
- Field data from the Eno River (csv file)
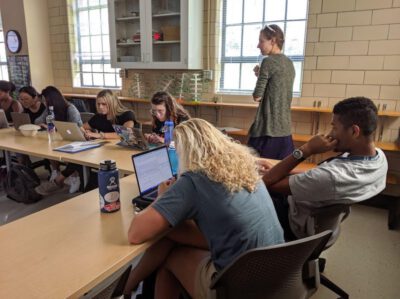
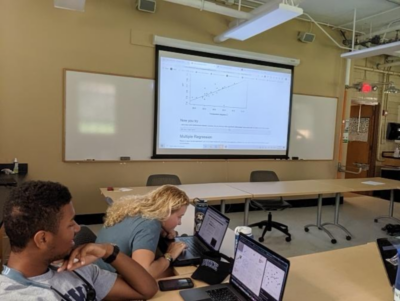
Photos from the class