Linda Adams (CompSci), Amanda Jankowski (Sociology, Global Health), and Jessica Needleman (Statistics/Economics) spent ten weeks prototyping small-area mapping of public-health information within the Durham Neighborhood Compass, with a focus on mortality data. They worked closely with the director of DataWorks NC, an independent data intermediary dedicated to democratizing the use of quantitative information.
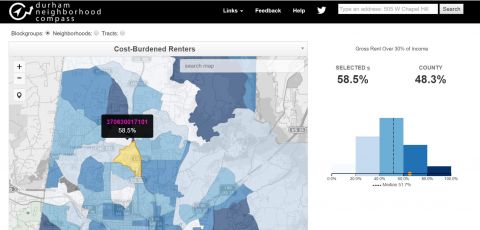
Project Results: The team created a publically-available R Shiny app that enables users to interactively visualize Durham County mortality rates at a variety of geographic levels. They also built an app which allows the visualization of more fine-grained, sensitive information for internal use by county health departments. Finally, they worked with the East Durham Children’s Initiative, a nonprofit organization that works to develop and coordinate services to meet the needs of children. The team was able to create a geospatial shape file that provides mortality data specifically tailored to the EDCI service area.
Click here for the Executive Summary
Project Leads:
John Killeen, Durham Neighborhood Compass
Project Managers:
Libby McClure

![]()