Understanding of how to manipulate, analyze, and display large datasets is an essential skill in the life sciences. Introducing students to the concepts of coding languages and showing them the diversity of tasks that can be accomplished using a flexible coding scheme like R is an important step in the training of any life sciences professional. For students taking lab-based courses, who are often required to analyze the datasets they produce in class, learning these techniques can be helpful both in the short-term (i.e., during the semester) and for their future careers.
Graduate Students: Eleanor Caves & Patrick Green, Department of Biology
Faculty: Sheila Patek
Course: Bio 329L: Principles of Animal Physiology
We first taught this Data Expeditions course to students in Bio 190S, a summer session Sensory Biology course aimed at beginning undergraduates. This experience showed us that if introduced to R coding concepts early in undergraduate education, students would be eager to use these tools in other courses and other contexts, inspiring us to teach this course again to a more upper level biology course. Therefore, we taught this Data Expeditions course to students in Bio 329L, a lab-based Animal Physiology course where students gather and analyze their own data. We chose this course for our Data Expedition because the laboratory component of this course often requires that students analyze data from lab experiments, and create representations and plots of their data for use in lab reports. Our goals were to give students an introduction to a specific concept in animal physiology, how real data from this field looks, and how these data may be analyzed, to help inspire them to use R to create figures for their own lab reports. Over the course of two, 1.5-hour class sessions, 17 undergraduates were given the opportunity to explore a dataset on the color vision capabilities of cleaner shrimp.
Guiding Questions
- What is color? How is color perceived in the sensory system? How might variation in the ability to perceive color influence an animal’s ecology and evolution?
- What are the color vision capabilities of cleaner shrimp, as shown by the spectral sensitivity curves that you generated using the dataset?
- Given our knowledge of cleaner shrimp visual physiology, what limits does this place on what parts of their world they can or cannot perceive, and how does this inform our hypotheses regarding their interactions with each other and with other species?
The Dataset
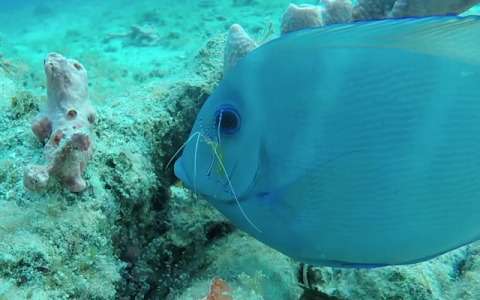
The data were collected by Eleanor Caves as part of her doctoral thesis to investigate the color vision capability of these three species of cleaner shrimp. Cleaner shrimp are colorful crustaceans that are an important part of the health of coral reef ecosystems, as they provide “cleaning services” to reef fish by removing ectoparasites from fish. The ultimate goal of this project was to investigate how cleaner shrimp perceive the color patterns of both their conspecific cleaner shrimp and their fish partners, as part of a larger project to understand the evolution of cooperation between different species. The data set we used in class describes the dark-adapted spectral sensitivity (i.e. color vision capability, or sensitivity to different wavelengths of light) in three species of cleaner shrimp. From 6 individuals from each species, we documented the collective response of photoreceptors in the eye to wavelengths of light at 10 nanometer intervals (350-610nm), during Summer 2014, using a technique called electroretinography (ERG). ERG involves inserting a metal microelectrode into the eye of a live animal and then exposing the eye to different colors of light, to record the response of the eye to that light. Each row in the dataset is ERG data for a single individual at a specific wavelength, i.e. the normalized magnitude of the response of the eye (between 0 and 1) to that wavelength of light. Because we had 27 wavelength values at which we tested spectral sensitivity for each individual, there are 27 rows of data per individual, of 6 individuals for each of 3 species. There are four columns in the dataset, representing wavelength (every 10-nm), species (three total), individual ID (1-6 for each species), and ERG response.
In-Class Exercises
Eleanor first presented a lecture introducing the concept of color and how color is perceived by sensory systems. This lecture included the basic physiology of rods and cones (the core sensors of the visual system) and how information from rods and cones is integrated in the brain to give a perception of color. This structure followed the basic setup of lectures in 329L, giving students an understanding of the underlying physical concepts that lead to a physiological phenomenon (here, color vision). Next, Eleanor gave the students an introduction to the ecology of cleaner shrimp and asked them to make predictions about their color vision capability based on what they knew about the animals’ interactions with other cleaner shrimp and coral reef fish. These slides are available on the website for this DDE course, along with notes for each slide (see point 1 below in “further resources”).
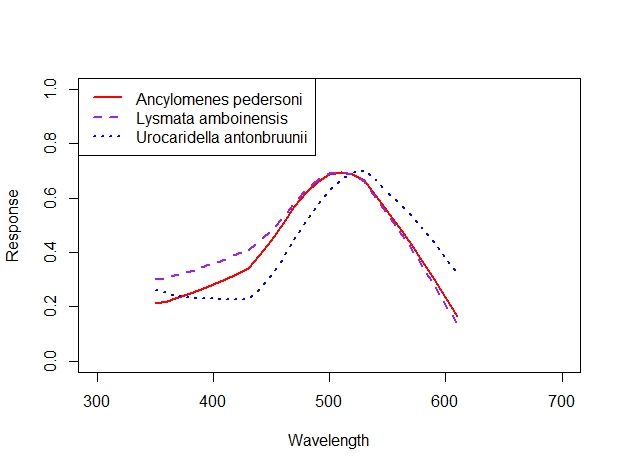
Patrick led the R coding session while Eleanor helped students with coding issues on a one-on- one basis. We helped students download R and R Studio and taught them how to upload a dataset and explore the structure and content of that dataset using various commands. We then worked through subsetting and indexing to isolate data from a single individual; plotting data and working with functions to change the color or shape of data points, add best fit lines, and change line width and type; lowess smoothing functions to create smooth spectral sensitivity curves. The final product that the students created in class is shown below and represents a figure of spectral sensitivity for several individuals of the same species – each individual is differentiated by a different color line.
Many students encountered error messages during their coding lesson. These included errors in indexing as well as plotting. We used these errors as teachable moments, showing students how to diagnose and fix errors by going back and checking their code line-by-line. While we did not expect these errors initially, they ended up being a valuable addition to the course material.
At the end of class, students compared their results to their predictions. Only two of the 17 students predicted that cleaner shrimp would have one spectral sensitivity peak (i.e., be colorblind); most students predicted greater than 3 peaks. We discussed why cleaner shrimp may be colorblind and how they might still make important life-history decisions without the need to perceive color. Finally, we discussed how students can use the skills they learned to analyze the data they collect in 329L labs.
After the course, students used the “daily test” structure of 329L to give feedback, including (1) something they learned from the course, (2) a question they still had, and (3) any other information they thought would be useful for us to have. Quotes from this feedback include:
“I learned that you could turn words (code) into graphs. I never realized you could graph things on R and I feel like that will be really helpful in the future.”
“R is really helpful for visualizing data and reorganizing it in a more streamlined way than you could do it in Excel. I can appreciate it as a research tool much more now than I could as a freshman in biostats!”
“I would like to learn more about animals that have cones but don’t see in color. Do you think this is the early stages of these species eventually developing color vision?”
“I learned that R can be incredibly helpful in plotting a lot of data although sometimes getting a large dataset into workable chunks can be difficult (subsetting).”

Source of the Data:
Caves, E. M., Frank, T. M. and Johnsen, S. (2016). Spectral sensitivity, spatial resolution, and temporal resolution and their implications for conspecific signaling in cleaner shrimp. J. Exp. Biol. 219, 597–608.
As a final set of resources, here are links to videos in case viewers of the Data Expeditions website are interested in learning more about this system:
- A short video produced by Duke University about the manuscript that was published using this dataset
- A short video from fieldwork conducted by Patrick and Eleanor, showing cleaner shrimp in action in Curaçao, Netherlands Antilles