Graduate Student: Jacob Coleman, 3rd year Ph.D. student in Statistical Science
Faculty Instructor: Colin Rundel
Class: STA 112, Data Science
- Data management, summarization, and exploration with R package dplyr
- Data visualization through R package ggplot2
- Worked with state-of-the-art data pulled from online source
Summary
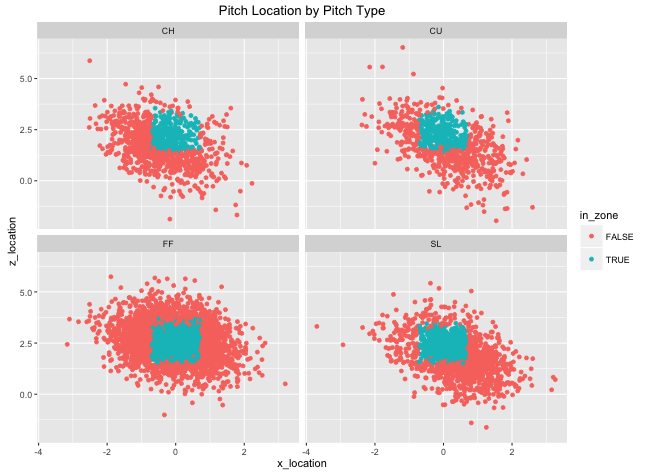
In this Data Exploration, students were introduced to baseball dataset Statcast, downloaded from baseballsavant.mlb.com, that included every pitch thrown in the first week of the 2016 season, with 19 characteristics. The students were tasked with using R packages dplyr and ggplot2 to answer data exploration and summarizion questions. The exercises challenged them to use information about the data as well as newly acquired computation skills.
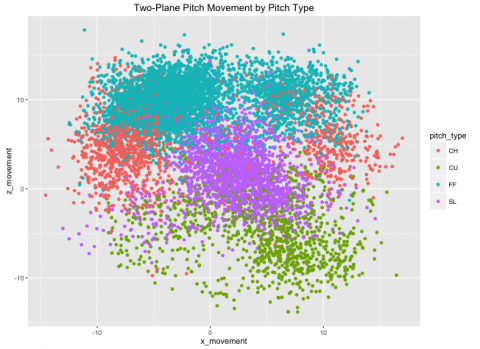
The Statcast data is owned by MLB Advanced Media, L.P. and was downloaded from a search performed on baseballsa- vant.mlb.com for all pitches from 4/1/16 to 4/7/16. Statcast is a relatively new dataset (introduced in 2015), including all pitch characteristics from its precurser PitchF/X (such as pitch movement, type, start and end velocity, etc.). Statcast also added tracking of the ball during the entirety of the play, as well as tracking for all fielders. Full Statcast data is not yet available to the public, but Baseball Savant allows the public to have access to Statcast-added batted ball variables such as launch angle and batted ball speed.
Dplyr is an extremely powerful tool for exploring data, using simple structure to perform complex data management tasks. Students were introducted to dplyr in a previous lecture, and used the Statcast data to gain hands-on experience working with data. Their tasks ranged from simple summaries to sophisticated manipulation (as real data is rarely in perfect form for desired analysis). They also integrated the R package ggplot2 to visualize some of their findings and draw futher conclusions.